Itchn2retire's Account Talk

Well, I guess it's about time for me to start my own thread. I don't have any value to add to the forum so this thread will be starting off with a bunch of newbie-dumb questions. Here’s my first.

I want to gain a better understanding of the charts that get posted so I’ve been reading up on them. My learning style is more of a hands-on so the best way for me to learn is to run/review my own charts which I have been doing at Bigcharts.com and Stockcharts.com. (No subscriptions. Just using what’s free.)

I’ve decided to start with the candlestick chart as that seems to be the more popular of them all. What settings are good for a person just starting out in chart analysis? The settings I use now are:

Moving averages: (50 & 200). I would think that 200 is a bit high.
Indicators: Slow Stochastic (14,3) Standard setting on Stockcharts.com
MACD (12,26,9) Standard setting on Stockcharts.com
RSI (14) Standard setting on Stockcharts.com

I go to investopedia.com to get the explanations for each of those but there’s a lot of information there too so it’s all a bit overwhelming.
 
...I’ve decided to start with the candlestick chart as that seems to be the more popular of them all. What settings are good for a person just starting out in chart analysis? The settings I use now are:
Moving averages: (50 & 200). I would think that 200 is a bit high.
Indicators: Slow Stochastic (14,3) Standard setting on Stockcharts.com
MACD (12,26,9) Standard setting on Stockcharts.com
RSI (14) Standard setting on Stockcharts.com

Itchn,
Let me be the first to welcome you to your own Account Talk. (Maybe Tom can help you out with the misspelling on your Account Talk Title :blink:)
I am not the most versed in the charts, but you can look at their charts and see what they follow. For me, the ones you mention are the ones I use. I usually add in the 20-day and use exponential moving avg, but your call. I also keep tabs on the bollinger bands.

There are a lot of savvy people here. Pick and choose your favorites, but always make up your own mind. Good Luck!!
 
Itchn,
Let me be the first to welcome you to your own Account Talk. (Maybe Tom can help you out with the misspelling on your Account Talk Title :blink:)Done
I am not the most versed in the charts, but you can look at their charts and see what they follow. For me, the ones you mention are the ones I use. I usually add in the 20-day and use exponential moving avg, but your call. I also keep tabs on the bollinger bands.

There are a lot of savvy people here. Pick and choose your favorites, but always make up your own mind. Good Luck!!


Itchn, There will be a few people willing to help out. Starting your own thread is heading in the right direction. Welcome abaoard.
 
Just ordered the Candlestick Charting for Dummies. (I forgot about those "Dummies" books until yesterday.) I already understand the basics so maybe the book will help with some of the finer points. After I get comfortable with candlesticks maybe I'll move on to PnF charts. :rolleyes:
 
So as I've stated in the past I'm reading up on how to view (understand) candlestick charting and the different indicators associated with it. Another chart I've been studying is the Ichimoku chart and I found a pretty good website (free) if anyone is interested. The major indices are already listed but there's a seperate field where you can add other ticker symbols.

I like this site. Maybe you will too.

Ichimoku Trader - Ichimoku charts of shares & stock market indices

Very interesting addition to my candlestick chart reading library. Thank you!!

Frank
 
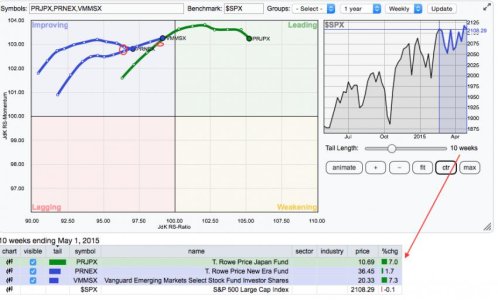
So when “Mr. JohnRoss” posted that he was looking at RRG charts I thought it may be helpful if I posted how I use them to identify mutual funds where I can rotate my investments. I am not going to get into explaining the RRG chart so to become familiar with them go to StockCharts.com “chart school” to read about them. ( Relative Rotation Graphs (RRG Charts) [ChartSchool] )

To create a RRG chart the link is listed on the right side of the web page under the “Charting Tools” box. Or you can click here. RRG Charts - StockCharts.com

To see how it works I’ve provided a string of ticker symbols from Vanguard. You can copy-n-paste them into the "Symbols" field and then hit the update button. If you select the “animate” button you will see the funds rotate through each of the sectors and it will be clear what the RRG chart does.

VFIAX, VDEQX, VDADX, VDIGX, VEIPX, VFTSX, VQNPX, VIGAX, VHDYX, VLCAX

As the funds rotate through the quadrants my strategy is to find those that have moved into the “improving” block” and sale any fund(s) that are heading toward the “Weakening” block thus always riding a wave up and jumping off when it looks like an investment may be weakening. The circles on the chart show where I purchased three mutual funds that I will mention in this thread. The tail length can be adjusted for the number of weeks you want to display and it then shows the % change on the chart below.

Screen Shot 2015-05-03 at 5.06.19 PM.jpg

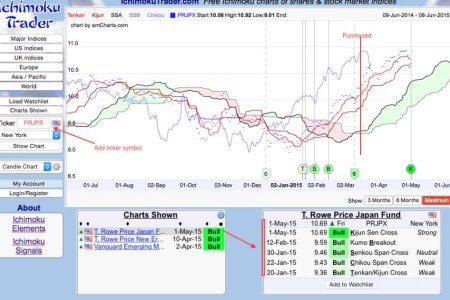
After identifying a particular fund I check it against the Ichomoko chart. Ichimoku Trader - Ichimoku charts of shares & stock market indices (I’ll use the T-Rowe Price Japan fund (PRJPX) for this example) If you add the ticker symbol you will get the chart shown below. I purchased PRJPX in mid-March which is shown by the red line on the chart. As you can see it was well ahead of a “break-out” from the Chikou (cloud) and all indicators show a “bull” signal. (wished I had caught that a few weeks earlier.)

IchimokuTrader.jpg

If the fund passes the first two charts then I’ll give it further review with a candlestick chart and indicators of my choice.

So it’s a three step process.

Check the RRG chart to identify funds moving into the "improving" quadrant.
Further validate that against the Ichimoku chart
Review the Candlestick Chart


What I have purchased so far using this method is:

T-Rowe Price Japan Fund (PRJPX). 7 weeks since purchase. 4.6% return to date.
Vanguard Emerging Markets (VMMSX). 3 weeks since purchase. 2.2% return to date.
T-Rowe Price New Era Fund (PRNEX). 1 week since purchase. 1.1% return to date.


Once the funds hit the ceiling and start to drop I’ll identify new funds and the cycle starts all over again. Hopefully this will keep my investments in funds that are always in the earnings cycle. I'm using this strategy for my intermediate to long-term investments. (Learn to read/understand the RRG chart. Just because a fund may be heading down on the chart does not mean it's loosing money. The chart does not track price.)

While I track the TSP funds I'm not sure this method is very good for trading on TSP due to the limited number of funds in our portfolio. But I think it may work well if you have investments outside of TSP.
 
Last edited:
I jumped from G to C/S funds on 1 May even though my indicators told me to wait. One IFT burned already. Lesson learned I guess. (I'm still figuring this out.)

I'm with JTH in that I may need to jump on the F-Fund train this month. It looks to be primed for an upswing when compared to some of the indicators of the past. And the indicators that are showing now are even lower than those in the past. Only one way to go and that's up. Right? :rolleyes:

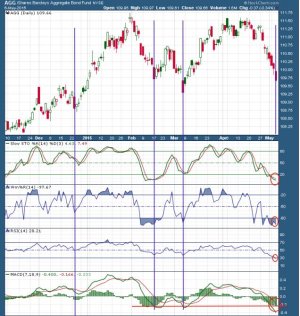
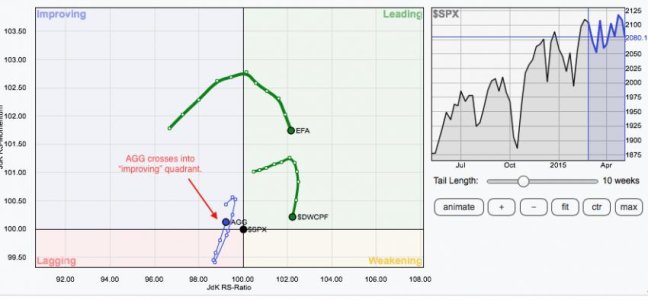
RRG Chart also shows AGG crossing into the "improving" quadrant.

Looking for a bullish candlestick pattern by Friday.

AGG-6 May.jpg


AGG RRG - 6 May.jpg
 
Last edited:
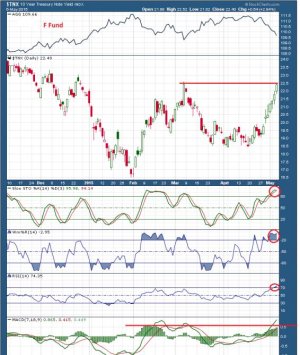
And since Treasury Yields track in the opposite direction of the F-Fund they look primed to drop which hopefully translates to the F-fund rising if past performances repeats itself.

TNX Graph.jpg
 
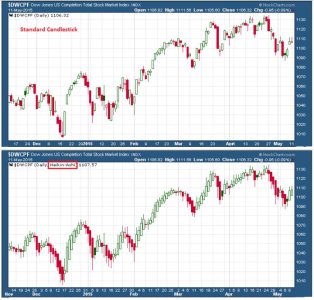
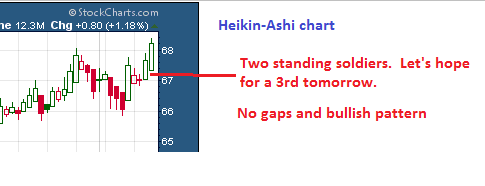
I started using the Heikin Ashi chart as a secondary view to the normal candlestick charts for my TSP since I also use that chart for my mutual funds. It does a great job smoothing out the trend by calculating the current and previous price activity to establish an "average". Makes reviewing the chart activity a little less nerve racking when there's large movements. Case in point, the big gap in the "S Fund" from last Friday. If you look at the Heikin-Ashi there's no gap and the last two candles closed positive with no wicks at the bottom. (see charts below.) It will be interesting to see what occurs today and how those changes are reflected in the Heikin-Ashi.

I find this type of chart very useful. Does anybody else use it?

Explanation of Heikin Ashi Heikin-Ashi [ChartSchool]

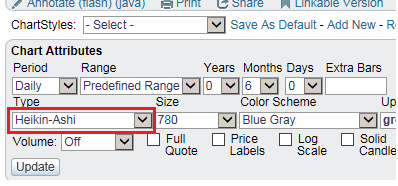
The Heikin Ashi can be found under the charts attributes. (see screenshot #2)

Heikin-Ashi.jpg

Heikin-Ashi attribute.png
 
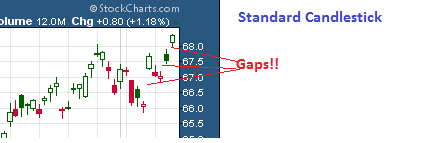
I'm starting to really like this Heikin-Ashi chart. Look at the difference in the I-fund between the two chart styles. I like have all the "noise" removed from the daily changes. I'm going to continue watching and maybe start basing my decisions of IFT's against this chart style. On the standard chart I want to cash-out now with all them gaps but the Heikin is showing a bullish trend.

Let's see what tomorrow brings.

Standard.png

Heikin-Ashi.png
 
Itchn2retire, here is some more interesting info on FERS supplement.

Thanks S2R, I'm familiar with the supplement but that is a good resource. (I'm gonna book mark that page for future reference.)

Hey Itchn...do you have to be fluent in Japanese to read those correctly?
Well that's the beauty of this chart. It already figures out the "averages" for you. A schmuck like me can even figure it out. :nuts:
 
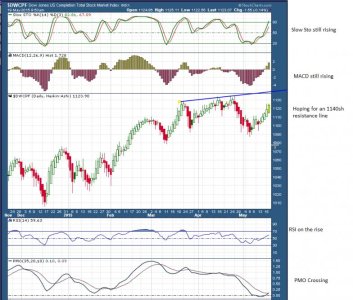
I was split between the I & S funds during the month but have rebalanced to 100% S-fund as of COB yesterday. With the I-Fund looking like it had topped out and was ready for a dip coupled with the Dollar primed to begin rising I pulled out of the I-Fund. The S-Fund looks like it still has some steam left to it (see chart) so I'll ride that up a little bit longer and then secure my gains when it looks like it's about to roll over.

I'm still work'n on my trading/investment style so we'll see soon enough if this plays out in my favor.

S-Fund 5-19.jpg
 
Back
Top