08/19/25
The major stock market indices were flat, mixed, but the broader market was mostly positive as small caps led the large caps on the upside. Yields and the dollar were up but otherwise it was an uneventful day. These sideways moves are constructive as they can help take the indices off their overbought conditions, but it is also a sign of fatigue that could be signaling the need for a pullback. The recent momentum may say otherwise, making it tough to time.
(The most current commentary is always posted here: www.tsptalk.com/comments.php)

| Daily TSP Funds Return
More returns |
The indices were flat but because small caps outperformed, we did see some positive internal numbers with advancing issues outnumbering decliners, and trading volume was heavily positive. It was peculiar action given yields and the dollar were up, and the large caps didn't help.

The S&P 500 (C-fund) was flat but it may have broken some short-term support. Not exactly a reason to sell, but it is something different, and something to watch. There is more support at the July peak, but then it is well above the second wall of support which would be the 20-day average near 6371, and then the two support lines converging near 6350.

Yields did tick up and actually closed above the 50 and 200-day EMAs yesterday, but yesterday's high did make a perfectly parallel channel with the prior June / July lows so we'll see if that new line will hold as resistance, or if it wants to make run for that blue resistance line near 4.4%.

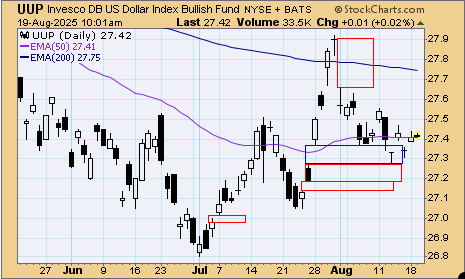
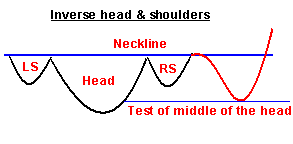
Probably as boring as it gets to most people, but the dollar's UUP chart has been intriguing to me. The inverted head and shoulders pattern broke out with authority in late July, then it came tumbling right back down testing the 50-day average and looking into that red open gap. This looks like bottoming action, but if it wasn't for those open gaps, I would be calling this a failed breakout.
It is quiet right now so investors may be waiting for the 2025 Jackson Hole Economic Policy Symposium being held later this week -- starting on August 21. While many European Central banks have been cutting interest rates aggressively, the US Fed may will have to explain further why they have been holding steady and going against the global trend.
The DWCPF / S-fund was up nicely yesterday and held at the blue dashed support line for a third straight day. This could be considered a double top pullback, but so far the bears have done little to take advantage of that bearish set up.

ACWX (I-fund) made a new closing high with that modest 0.08% gain yesterday. That was an impressive small gain given the dollar being up 0.26% on the day. This looks bullish as long as it remains above that July peak, but look at all of those open gaps below. How long can they go unfilled?

BND (bonds / F-fund) dipped yesterday with yields rising, but it may be the Jackson Hole meeting that makes or breaks this chart which is sitting on the fence between a breakout, and another pullback. You may have noticed that this chart rarely goes straight up. Even rallies are choppy.

Thanks so much for reading! We'll see you back here tomorrow.
Tom Crowley
Read more in today's TSP Talk Plus Report. We post more charts, indicators and analysis, plus discuss the allocations of the TSP and ETF Systems. For more information on how to gain access and a list of the benefits of being a subscriber, please go to: www.tsptalk.com/plus.php

Questions, comments, or issues with today's commentary? We can discuss it in the Forum.
Daily Market Commentary Archives
For more info our other premium services, please go here... www.tsptalk.com/premiums.php
To get weekly or daily notifications when we post new commentary, sign up HERE.
Posted daily at www.tsptalk.com/comments.php
The legal stuff: This information is for educational purposes only! This is not advice or a recommendation. We do not give investment advice. Do not act on this data. Do not buy, sell or trade the funds mentioned herein based on this information. We may trade these funds differently than discussed above. We may use additional methods and strategies to determine fund positions.


