Investor Fear Chart

It's all about the extremes on both ends. March to May 2020 saw multiple weeks with bears over 50, a number not seen with such consistency in many years.
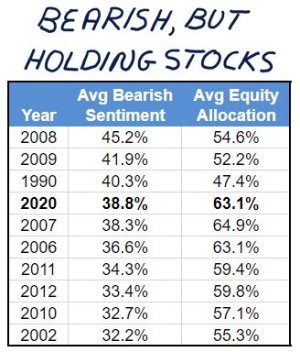
AAII members have often kept more than half of their portfolios in stocks even when their collective pessimism about the short-term direction of the S&P 500 index has been comparatively high.

This is not paradoxical. Disciplined investors prevent their short-term outlooks from interfering with their long-term strategies.

waerwegsd.JPG
 
AAII, Bulls keep dropping as the market marches higher. Bull/Bear ratio around 1.05, right where we were just before election.

This week compared to the historical average of bulls is around normal, but the bears are 5% higher than average.

https://www.aaii.com/sentimentsurvey?
 
Big jump in bullishness past two weeks, 37.4 to 47.1 today. Bearishness has also dropped 35.6 to 25.4.

We really haven't seen a good pullback since late September and since then, bullish readings have been quite elevated at levels higher than any seen in over two years. It's a government policy rally and participants are happy as long as the government continues to stimulate or talk more of it.
 
AAII, even less bears this week, but if the poll was taken today that would surely be higher.

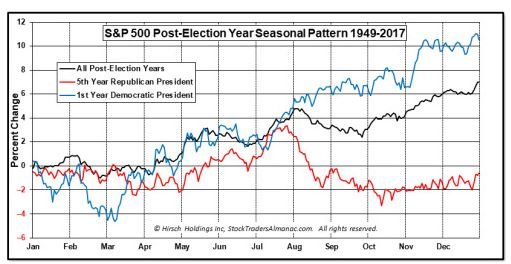
Not sure where to post this, but here's how markets behave 1st year post election. Correction, then rally? February 2021 was an up month though. Full moon this weekend sometimes marks a turn.

View attachment 48533

https://jeffhirsch.tumblr.com/post/...sidential-election-anticipation-is-keeping-us

Here is why this one is different:

All those other “1st year Dem’s” have been with new people forming a new government. This time Biden has enough experience to hit the ground running, and has already gotten many of his policy changes that he can do by executive order already issued, and many of his people settling in to the places needed most. I think he’s going to be much quicker on jump starting the economy- if he can just get the 1.9 trillion jumpstart through. That should bolster the markets in the next month.


Sent from my iPhone using TSP Talk Forums
 
Off topic, but related, the seasonality chart for February did a pretty good job as well of forecasting direction.

022721a.gif

Chart provided courtesy of www.sentimentrader.com


March is similar with an even more pronounced difference between the first and second half of the month. I'll post that in Monday's commentary.
 
AAII showing no fear at all with bull bear ratio at 1.5. We'll want to see this down at 1 or lower for indications of a turn.

40 Bull to 25 Bear which is still quite bullish.
 
Two things.

1. The chart in post #44 shows a flat/choppy market from May until August for the first year of a Democratic president.

2. CNN Fear/Greed index is at 30 right now which is around where it was in late October until the election.

If this bull market is still intact (and all indications appear it is) then chances are this is the beginning of a good buying opportunity similar to that of September to November 2020. Low can always go lower, and trying to pin a bottom is a fools game, but those who like high flying PE stocks can get 'em a whole lot cheaper today than a few months ago.
 
AAII comes in at 40 Bulls, 20 Bears, which is a low bearish number.

Mostly just data mining here, but early April brought a decent sell signal with 51 or so Bulls and 20 Bears. Would selling have been the right move? Probably not since the market has been trending sideways since April with a small spike higher. AAII continues to indicate a sideways trending market which makes sense. I can't imagine there being as many market participants this summer with the reopening.
 
Funny how so many were "looking for a dip to buy" the past few weeks. Here it is, yet fear reigns supreme. Don't follow the crowd.

fear3.JPG
 
Finally, a non-boring reading in the AAII.

Bulls at 22, lowest since July 2020.
Bears at 39, lowest since October 2020.

Ratio of .57 which leans bullish.
 
Bears unchanged, Bulls +7% to 29%.

According to AAII
*Pessimism is above average for 8th time in 10 weeks
*Pessimism remains near the top of its typical historical range
 
Bulls 28.1, Bears 40.7

Bearishness has not been this high (three weeks now) since October 2020.
 
AAII at 46.9 Bull, 27.8 Bear.

Highest bullish reading since December 10, 2020, lowest bear reading since September 9, 2020. I'm thinking all those newly minted bitcoin bulls (ETF: BITO) had a little something to do with the wildly bullish sentiment this time around.
 
AAII 21% bull, 47% bear. Lowest bull reading since July 2020, highest bear reading since September 2020.
 
AAII 26.5% Bull, 43.7% Bear.

Last week was a bear reading of 52.9%, the highest since around September 2020. Same with the bull reading, lowest since September 2020.

CNN fear and greed not yet at an extreme.

It looks like we're one more washout away from a good buy signal.
 
AAII 16.4 Bull 59.4 Bear. This is the highest bear reading in a year and actually the most bearish reading in over six years. Coupled with such low bull readings, this is bullish for the market.

eerews.JPG
 
Back
Top