FogSailing's Account Talk

Ok, we just dropped below support at 2752 so 2739 is up on deck. After that 2723 I believe is the next pit stop. Between these points who knows what happens before a return to the downside. But I'm still looking at 2560 before we see a substantial rebound and I still think we see a 4-6% correction before the broader market turns around.
 
Below 2719...look out below. That is the emotional statement from many traders. My feeling are that the market makes a small bounce at 2719 or thereabouts....just cause it's the market. We'll see how the day closes out. On the other hand, if this is impulsive...2700, 2583, 2650 is up on deck...

Good luck everyone..

FS
 
2722 anyway...then a much stronger close to the day than I thought we would get with 2743 at the bell. Makes a strange end to the day...especially with lower than average volume and a late day spike in VIX. Not a market that is easy to play for sure!

have a great weekend all!
 
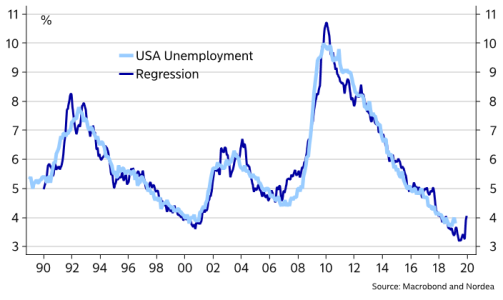
Not liking this chart...

unemployment.png

Still I feel we're close to a bounce...maybe it pulls back to 2710-2720 area. Lots of support there..

Then we see what we shall see..

FS
 
Looks like we're headed up to as high as 2788 before significant Resistance. Looking good for a few sheckles as long as it stays above 2749. Then I'm still expecting a retrace to the 2710 area.

FS
 
Quite a week. Made the 2830, so now what happens? Some smart folks are saying that the SPX and Dow will likely realign next week. I'm seeing 2680 being thrown around as likely pullback. Of course if the Dow rallies to new highs before declining below last week’s lows, this scenario is wrong. Likewise, if SPX rises over 2876, same story. Lots of drivers up next week...FOMC for example. Good luck out there.

FS
 
This from a trader I respect..."2815-2820 has been major resistance for the past year. Where it has closed above that level 3 days in a row. off to the races. Fail here by tomorrow close... 2600 is still on the table." The high water mark today was 2834. No idea what happens tomorrow but I think this market is artificially inflated by FED, PPT, ???)

FS

...I think this market is artificially inflated by FED, PPT, ???

Hey FS, interesting post.

Someone once or twice said, "irrational exuberance."

Personally, I don't know if it's rational or not; inflated or not. Someone else set forth a theory about things being relative to your perspective.

So, if one bought in 1973, they might be irrationally exuberant right now. But if they bought in September of 2018, they might not be.

Whatever this is ... whatever we call it ... it can stay this/that way for a long time. Even so, we can still profit when whatever this is pops, breaks, or otherwise stops ... or even if it keeps going ...

... as long as it goes anywhere but flat.

An extended flat market, with moves up or down being infrequent and almost instant. That's my real fear: a totally and completely efficient market.

Irrational Exuberance? Or the New Norm?:

ByCsOcTPN.png
 
Hi Q. Thanks for the post. You're point is well taken. The market is not emotional. It is a perfect feeding machine...usually feeding on me.

Based on the fact that the S&P, Dow, and Russell patterns all looked very similar today and the NASDAQ appears to be working to mirror their patterns, it would be easy to say we appear headed toward an immediate decline. But I'm guessing not. The reason is that there is a lot of support in the 2620 area. My thought is the markets start down tomorrow and then begin a rally to the 2670 area. No idea if it melts up quickly or slowly before a pullback. We'll see how tomorrow goes. Under 2850 and I'll probably get bearish. Above bullish. All the best.

FS
 
I don't like posting more than once a day but this is an observation from a trader who I highly respect. Just FYI. Glad i'm in G right..

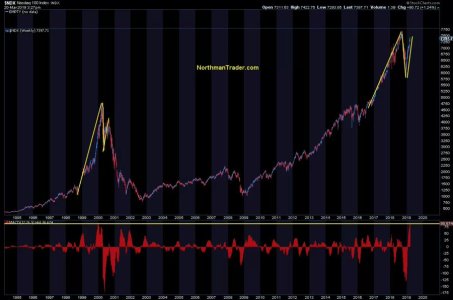
Besides the right shoulder of a 14 month H&S now potentially being set in place, there is an ominous analog that has been playing out, and that’s the fractal from 1998-2000. After a parabolic rally into the March 2000 top, the market had a sharp decline for 3 months, then rallied sharply straight back up for 3 months, and then crashed. The same thing has happened since 2016. A parabolic move to the 2018 high, followed by a sharp 3 month decline, followed by a sharp 3 month rally straight back up. At this point, and until the market proves otherwise, I think yesterday was the equivalent of 8/31/2000, and today was the equivalent of 9/1/2000.

market.jpg
 
Interesting comparison. I was watching the ^DJT the past few weeks and the only thing that kept me out of the markets early this week was them dropping after the 18th. Now I am real glad to be in G. Last time the transports presaged a drop for me was around the first week of December last year. December was bad enough for most of us...but now you have to go posting about a comparison to 2000?!!! Ouch!!! What a way to end a week...

Cheers to a great weekend everyone!!!
 
Interesting things happening....I've been watching the inverted yield curve and bonds..that has my attention. The bond market looks ready for an event. Media is talking fears of recession abroad but at this point I'm noting it but not taking the bait. Still believe we're headed down to 2100. And I sometimes forget the PPT is there for a reason. Still, prices are too high and a correction is still due to my way of thinking. My guess is tomorrow is slightly positive with sideways action. Absent news of a great China deal, I think we're headed down. Trump is sticking with his tariffs. The pain has to show itself sooner or later.
 
My number for the market returning to 2880 or higher was 2836. Today SPX hit 2836.03 and them pulled back a few points. Monday is likely begins a squeeze or melt up headed to 2880. It's possible it retreats and we have an extended sideways before 2880 however. Algos do all the trading these days and I don't think like a machine. Who knows what happens. Read today that we're close to a Golden Cross. Last time was Feb 2016. That sounds like a good thing. I waiting for my next opportunity in April. Currently sitting on the Lily pad.

FS
 
Holding back. Waiting for a good buying opportunity. There is also a gap on the daily between 2874 and 2880. If we can hurdle over I expect further upside. In addition, there is a nice H&S on the $GOLD chart. so if that starts breaking down we could see a massive run in equities. On the other hand, it it doesn't make the hurdle......
Best of luck to your trading.

FS
 
Still have 2 IFTs burning a hole in my pocket. But I don't plan to use either of them until SPX exceeds 2898, or shows it's finally beginning it's journey back to 2583. It seems to thinking through the process with more sideways actions. We haven't seen any big declines like we did in December and the market still hasn't recovered above that the previous SPX high. I still think 2100 is on deck this year. But my May timeline now seems nuts. I'm setting a new target for September. We'll see how she goes.

FS
 
Who knows what goes down tomorrow. Word has it the Chinese Vice Premier will be here for the trade talks. China retreated from agreements it had made with American negotiators. Trump has declared that tariffs will be imposed effective Friday. Who blinks first. My guess, the bad news will come first, the markets will dip, and later when China begins to really see and feel the pain to their economy, they'll fold. Until then, I wouldn't be surprised at some pullback.

FS
 
I'm guessing 2855-2840 area tomorrow and a deeper retrace after Friday. Wouldn't be surprised to see us retouch the December lows. Who know what happens after we pullback. This has been a very robust market and the economy is still very strong.

FS
 
Back
Top