Here's a quick recap of January 2024, then a deeper dive into the Month of January, February, and where to look for the Yearly Low.
Closing out the month with a 2.7% gain, January 2024 ranked as the 25th best of 64 Januaries. In the JTH Account Talk thread, there's a chart posted showing the last 21 Positive & Negative months of January, and how these results impacted the following 11-months.
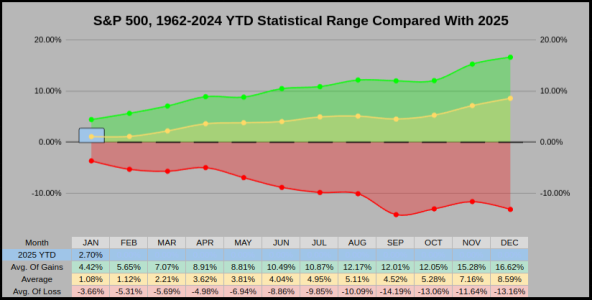
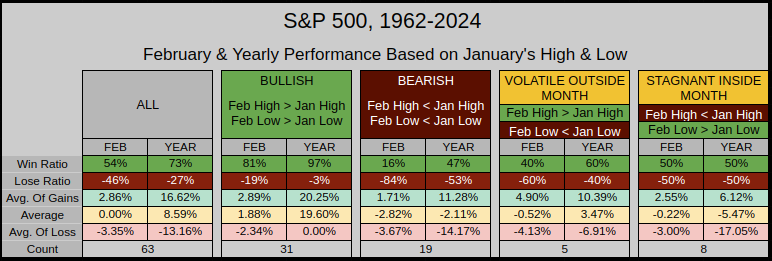
The chart below focuses on the January High & Low (as an established range) and the impact when February pierces through the Jan High/Low range. This data is filtered using the monthly high/low data, but the stats posted are monthly & yearly closing data.
---BULLISH--- 49% of the time Feb had a higher high & higher low, this increased the Feb win ratio from the normal 54% to 75% and the yearly from 73% to 92%
---BEARISH--- 30% of the time Feb had a lower high & lower low, this decreased the Feb win ratio from the normal 54% to 16% and the yearly from 73% to 47%
---MIXED--- Both an Outside & Inside month have a smaller sample of data, but in both cases the win ratios are lower than normal.
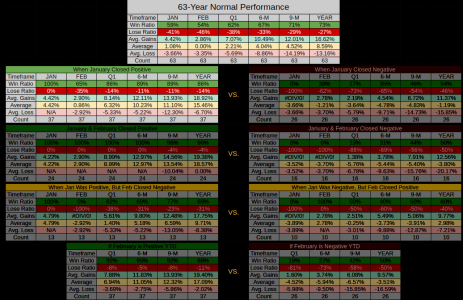
The chart below is a matrix showing the 63-Year outcomes based on January, February, and February YTD.
At present (on the 2nd chart) we've put in a positive January and from the these 37 of 63 years, this raised:
The February win ratio from the normal 54% to 65%
The Quarter 1 win ratio from 62% to 86%
The 6-Month win ratio from 67% to 89%
The 9-Month win ratio from 71% to 89%
The Yearly win ratio from 73% to 86%
At present, the first two charts are applicable to our current market conditions.
On a side-note:
Within our last 63 years, we can get both 29 positive & negative February's.
29 years of positive February's takes us back to 1972 where the yearly win ratio was 86% with an average gain of 15.29%
29 years of negative February's takes us back to 1963 where the yearly win ratio was 59% with an average gain of 2.25%
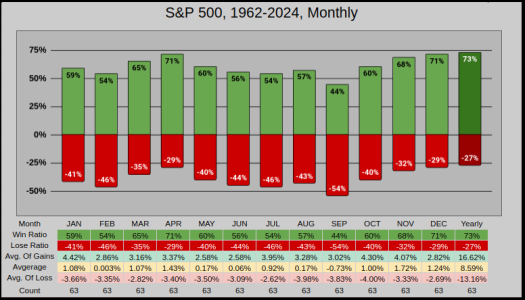
We can also take notice that the months of February & July are tied for the 2nd lowest 63-year win ratio at 54%.
While September is usually the front runner for worst month of the year, February is in second place with the 2nd lowest average gain at .003%
Last year in The Twelve Months blog, I sorted the bottom 20% (or 151 of the worst 756 months), and February took 2nd place.
So when things get bad, they've occurred most often in September/February/January & May.
If (like me), you're heavy on cash, then tracking where the yearly low can be found is a good place to look for buying opportunities.
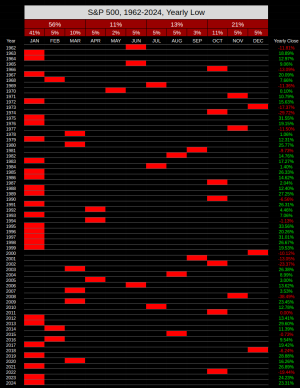
56% of the yearly lows fall within the 1st quarter and of the 17 years the index closed down, the yearly low was in the 2nd, 3rd, or 4th quarter (not the 1st). Using this data, we could speculate if the index pierces below the 1st Quarter's low, it's a serious caution flag.
To put it another way, 28 of 63 years had a yearly low in the 2nd to 4th Quarter, with 17 of those 28 years closing down. This gave us a 39% yearly win ratio when the index pierced below the 1st Quarter's low.
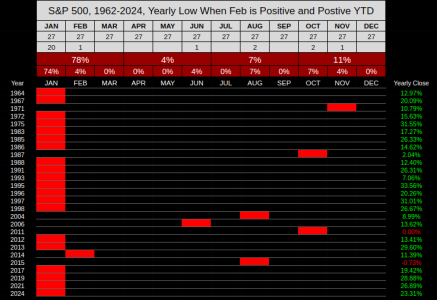
Adding some additional filters... There were 27 of 63 years where February closed positive, and we were also positive YTD at February's close. Under these filtered results, 78% of the yearly lows were in the first 2 months, with 2 of 27 years closing down (but both down years were flat).
To put it another way (under these filtered results) both the Feb close was positive and YTD positive 27 of 63 years. Of those 27 years, the yearly win ratio was 93% with 21 of 27 yearly lows found within the first two months.
Wrapping this up, "statistically speaking" based on January's performance we have reason to be optimistic, and if February closes positive, the stats get even better. But....What we can't account for is the impact of China's AI, nor the political noise concerning war, immigration, tariffs, and the reduction of our federal workforce.
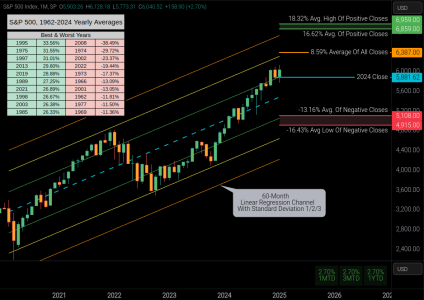
As a word of caution, the 5-Year Linear Regression Chart shows we are currently 10.26% above the fair-value center line which resides at SPX 5479. Those first two candlesticks on the far left of the channel are the COVID bottom, so we can anticipate this channel will rise as we move forward erasing those deep-red candlesticks.
Thanks for reading...Jason
Closing out the month with a 2.7% gain, January 2024 ranked as the 25th best of 64 Januaries. In the JTH Account Talk thread, there's a chart posted showing the last 21 Positive & Negative months of January, and how these results impacted the following 11-months.

The chart below focuses on the January High & Low (as an established range) and the impact when February pierces through the Jan High/Low range. This data is filtered using the monthly high/low data, but the stats posted are monthly & yearly closing data.
---BULLISH--- 49% of the time Feb had a higher high & higher low, this increased the Feb win ratio from the normal 54% to 75% and the yearly from 73% to 92%
---BEARISH--- 30% of the time Feb had a lower high & lower low, this decreased the Feb win ratio from the normal 54% to 16% and the yearly from 73% to 47%
---MIXED--- Both an Outside & Inside month have a smaller sample of data, but in both cases the win ratios are lower than normal.

The chart below is a matrix showing the 63-Year outcomes based on January, February, and February YTD.
At present (on the 2nd chart) we've put in a positive January and from the these 37 of 63 years, this raised:
The February win ratio from the normal 54% to 65%
The Quarter 1 win ratio from 62% to 86%
The 6-Month win ratio from 67% to 89%
The 9-Month win ratio from 71% to 89%
The Yearly win ratio from 73% to 86%
At present, the first two charts are applicable to our current market conditions.

On a side-note:
Within our last 63 years, we can get both 29 positive & negative February's.
29 years of positive February's takes us back to 1972 where the yearly win ratio was 86% with an average gain of 15.29%
29 years of negative February's takes us back to 1963 where the yearly win ratio was 59% with an average gain of 2.25%
We can also take notice that the months of February & July are tied for the 2nd lowest 63-year win ratio at 54%.
While September is usually the front runner for worst month of the year, February is in second place with the 2nd lowest average gain at .003%
Last year in The Twelve Months blog, I sorted the bottom 20% (or 151 of the worst 756 months), and February took 2nd place.
So when things get bad, they've occurred most often in September/February/January & May.

If (like me), you're heavy on cash, then tracking where the yearly low can be found is a good place to look for buying opportunities.
56% of the yearly lows fall within the 1st quarter and of the 17 years the index closed down, the yearly low was in the 2nd, 3rd, or 4th quarter (not the 1st). Using this data, we could speculate if the index pierces below the 1st Quarter's low, it's a serious caution flag.
To put it another way, 28 of 63 years had a yearly low in the 2nd to 4th Quarter, with 17 of those 28 years closing down. This gave us a 39% yearly win ratio when the index pierced below the 1st Quarter's low.

Adding some additional filters... There were 27 of 63 years where February closed positive, and we were also positive YTD at February's close. Under these filtered results, 78% of the yearly lows were in the first 2 months, with 2 of 27 years closing down (but both down years were flat).
To put it another way (under these filtered results) both the Feb close was positive and YTD positive 27 of 63 years. Of those 27 years, the yearly win ratio was 93% with 21 of 27 yearly lows found within the first two months.

Wrapping this up, "statistically speaking" based on January's performance we have reason to be optimistic, and if February closes positive, the stats get even better. But....What we can't account for is the impact of China's AI, nor the political noise concerning war, immigration, tariffs, and the reduction of our federal workforce.
As a word of caution, the 5-Year Linear Regression Chart shows we are currently 10.26% above the fair-value center line which resides at SPX 5479. Those first two candlesticks on the far left of the channel are the COVID bottom, so we can anticipate this channel will rise as we move forward erasing those deep-red candlesticks.

Thanks for reading...Jason
Last edited:
