Greetings (Last Chart Revised)
Here's a yearly projection, followed by a March Projection, capped off with a 9-day word of caution.
February 2024 was a phenomenal month, across the previous 63 years from 1961:
This Feb ranked as the 7th best of 64 Februaries with a 5.17% monthly gain.
Jan & Feb together rank as the 13th best of 64 with a 6.84% YTD gain.
While not a quarterly stat, at 11.57% this Dec/Jan/Feb together rank as the 9th best of 64 (from the Dec/Jan/Feb period a Top 15% close) and the 65th best of all 757 3-month periods, which makes it a Top 10% best ever 3-month performance.
___The chart below shows where we currently fall within the 63-year historical YTD range. While it's still too early to make a call, based on this data we might speculate (or project) a yearly close between 17.5% to 30%.

___For some more yearly projections, our current 63-year win ratio is 73%, but…
The 37 years January closed up MTD, the yearly win ratio rose to 86.5%
The 34 years February closed up MTD, the yearly win ratio rose to 85.3%
The 24 years both Jan & Feb closed up MTD, the yearly win ratio rose to 95.8%
Finally, of the 18 years Jan/Feb/Mar each closed up, our yearly win ratio was 100%

___Ok that’s enough of the yearly projections, lets pull back and look into the Month of March. March has a 65% win ratio (the 4th best month) and of those 24 years where both Jan & Feb closed up together, March has a 75% win ratio.
Statistically speaking, based on our current Jan/Feb performance, we might expect March to win, but give us less upside or (if it goes south) give up less downside.

___Here’s the March averages across the past 63 years correlated with Mar 2024. From a historical perspective, a seller may want to protect their gains above SPX 5257 while a buyer may want to increase their allocations below SPX 4952.

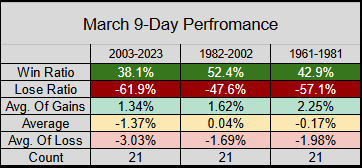
___(REVISED) Finally, here’s a word of caution. The beginning of March can get a little bumpy, from the previous 21-years, the 9-Day MTD performance has a 48% win ratio. The average -3.23% of losses is partially from:
(REVISED) Mar-2020 down -16.03% the famous Pandemic low, closing the month down -12.51%. Adding to this, over the last 3 of 4 years the 9-Day MTD performance has been down. But aside from this small hiccup, it could prove to be another great month.
View attachment 60371
Thx for reading and have a great March…. Jason
Here's a yearly projection, followed by a March Projection, capped off with a 9-day word of caution.
February 2024 was a phenomenal month, across the previous 63 years from 1961:
This Feb ranked as the 7th best of 64 Februaries with a 5.17% monthly gain.
Jan & Feb together rank as the 13th best of 64 with a 6.84% YTD gain.
While not a quarterly stat, at 11.57% this Dec/Jan/Feb together rank as the 9th best of 64 (from the Dec/Jan/Feb period a Top 15% close) and the 65th best of all 757 3-month periods, which makes it a Top 10% best ever 3-month performance.
___The chart below shows where we currently fall within the 63-year historical YTD range. While it's still too early to make a call, based on this data we might speculate (or project) a yearly close between 17.5% to 30%.
___For some more yearly projections, our current 63-year win ratio is 73%, but…
The 37 years January closed up MTD, the yearly win ratio rose to 86.5%
The 34 years February closed up MTD, the yearly win ratio rose to 85.3%
The 24 years both Jan & Feb closed up MTD, the yearly win ratio rose to 95.8%
Finally, of the 18 years Jan/Feb/Mar each closed up, our yearly win ratio was 100%
___Ok that’s enough of the yearly projections, lets pull back and look into the Month of March. March has a 65% win ratio (the 4th best month) and of those 24 years where both Jan & Feb closed up together, March has a 75% win ratio.
Statistically speaking, based on our current Jan/Feb performance, we might expect March to win, but give us less upside or (if it goes south) give up less downside.
___Here’s the March averages across the past 63 years correlated with Mar 2024. From a historical perspective, a seller may want to protect their gains above SPX 5257 while a buyer may want to increase their allocations below SPX 4952.
___(REVISED) Finally, here’s a word of caution. The beginning of March can get a little bumpy, from the previous 21-years, the 9-Day MTD performance has a 48% win ratio. The average -3.23% of losses is partially from:
(REVISED) Mar-2020 down -16.03% the famous Pandemic low, closing the month down -12.51%. Adding to this, over the last 3 of 4 years the 9-Day MTD performance has been down. But aside from this small hiccup, it could prove to be another great month.
View attachment 60371
Thx for reading and have a great March…. Jason