-
The Forum works well on MOBILE devices without an app: Just go to: https://forum.tsptalk.com
-
Please read our AutoTracker policy on the IFT deadline and remaining active. Thanks!
-
$ - Premium Service Content (Info) | AutoTracker Monthly Winners | Is Gmail et al, Blocking Our emails?
Find us on: Facebook & X | Posting Copyrighted Material
-
Join the TSP Talk AutoTracker: How to Get Started | Login | Main AutoTracker Page
You are using an out of date browser. It may not display this or other websites correctly.
You should upgrade or use an alternative browser.
You should upgrade or use an alternative browser.
DreamboatAnnie's Account Talk
- Thread starter DreamboatAnnie
- Start date
Do you see that they have Christmas in the stores even before Halloween? They are trying to sale early before people stop spending: JMO :nuts:
To be fair that seems to start earlier each year.
Sent from my iPhone using Tapatalk
DreamboatAnnie
TSP Legend
- Reaction score
- 833
DreamboatAnnie
TSP Legend
- Reaction score
- 833
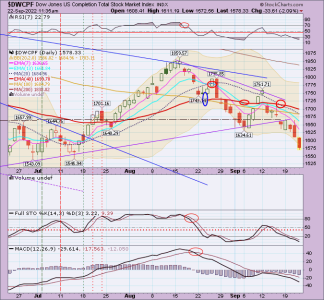
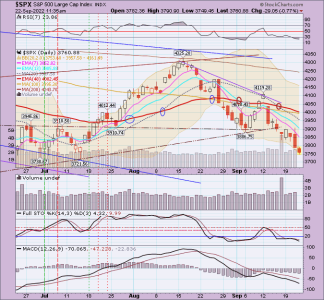
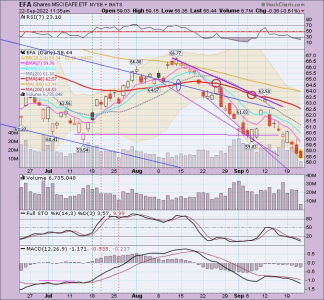
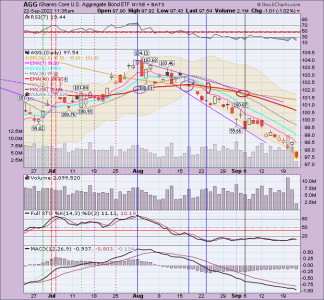
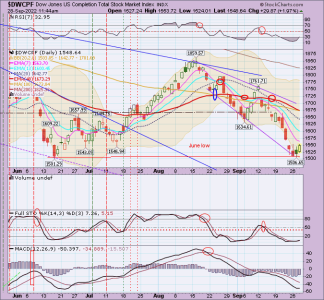
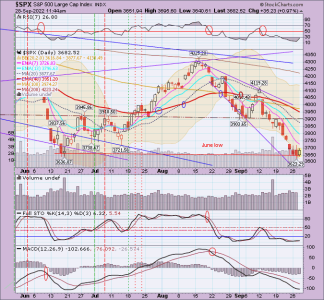
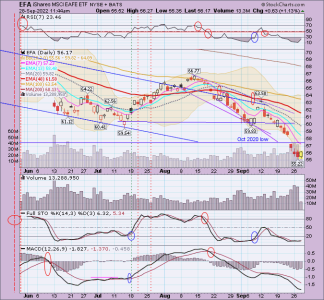
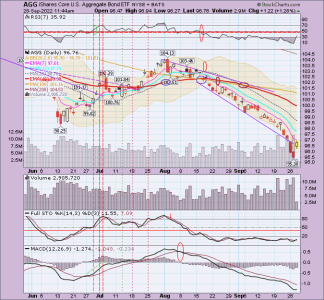
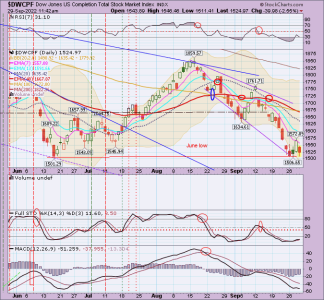
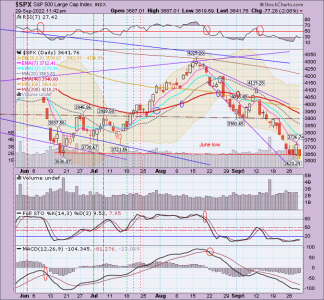
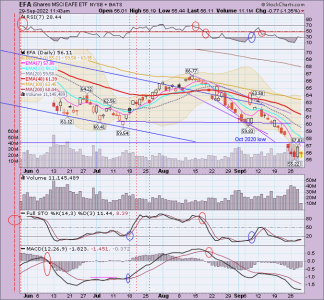
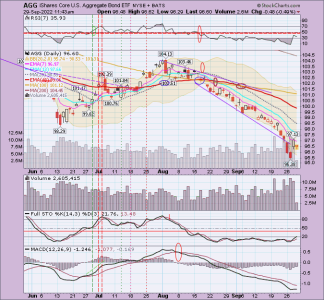
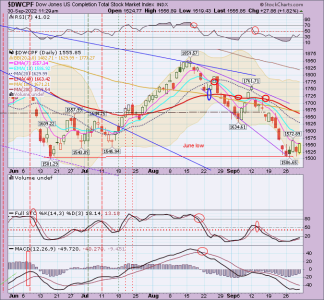
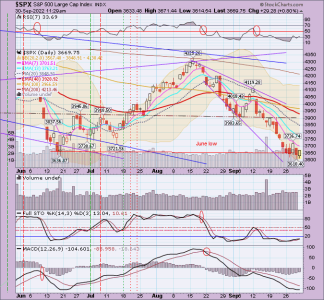
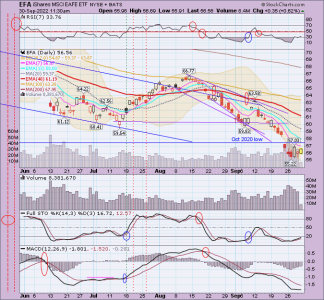
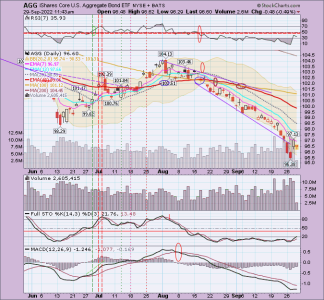
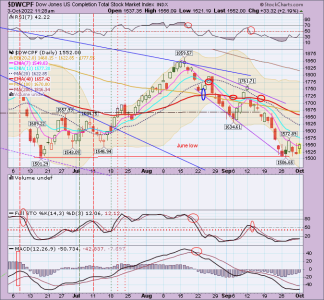
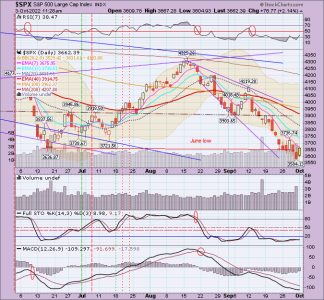
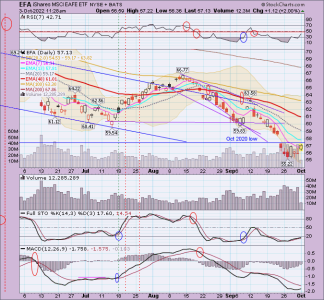
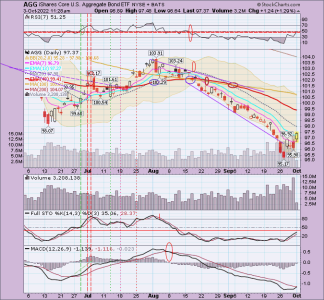
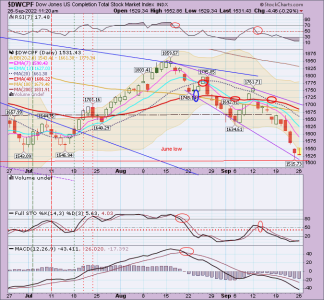
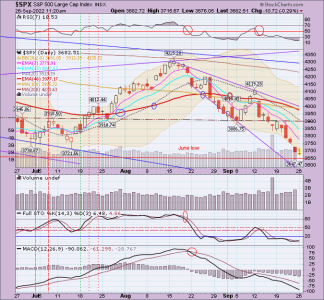
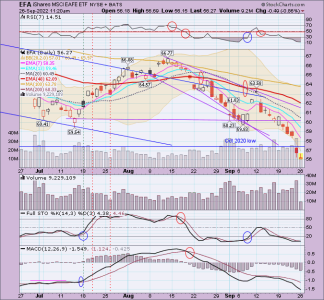
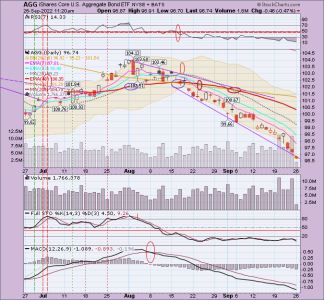
Charts... Drop continues. Was looking at Intrepid's weekly chart blog. At bottom has table of news-worthy events this week. Lots of Fed chairs talking all week but looks like real GDP revision numbers come out Thursday plus some consumer confidence index and Case Schiller info comes out Tuesday/tomorrow morning. We've dropped quite a bit.. About tge same as last leg down before the last bounce. Might be time for a bounce but I will wait. My entry indicators not even close on entry. Best wishes to you all! :smile:


DBA...always a pleasure. Look forward to your post "almost" every a.m. I am not much of a research guy. Like to be outdoors too much. Would love another lesson on stochastics. You can refer me back to one of your posts or if u have the time give "me" / us another lesson on your indicators and why they are "not even close" for an entry. I have been close to an entry recently to catch even a one/two day bounce and have not pulled the trigger. Have also noticed that u have remained on the sidelines since end of April w reluctance to get off the "lilly pad". I personally have caught the last two "major" drops and pulled out near the bottom (probably work another two yrs). You often mention not sticking to your planned "numbers" for entry/exit and have let emotion take over. Well, this seems like one of those times when we either end up catching the "falling knife" or miss out on some solid hard to find gains. Hard to make any money in the G. NAAIM numbers don't look good. Love your insights. Keep'm coming...
EJJ
EJJ
DreamboatAnnie
TSP Legend
- Reaction score
- 833
Thanks Shitepoke.. Will give info later today.:smile:
FYI to all.
Unable to post today. Please see signature for line fir permalinks to clean unlined charts. Best wishes!
FYI to all.
Unable to post today. Please see signature for line fir permalinks to clean unlined charts. Best wishes!
DreamboatAnnie
TSP Legend
- Reaction score
- 833
DreamboatAnnie
TSP Legend
- Reaction score
- 833
DBA...always a pleasure. Look forward to your post "almost" every a.m. I am not much of a research guy. Like to be outdoors too much. Would love another lesson on stochastics. You can refer me back to one of your posts or if u have the time give "me" / us another lesson on your indicators and why they are "not even close" for an entry. I have been close to an entry recently to catch even a one/two day bounce and have not pulled the trigger. Have also noticed that u have remained on the sidelines since end of April w reluctance to get off the "lilly pad". I personally have caught the last two "major" drops and pulled out near the bottom (probably work another two yrs). You often mention not sticking to your planned "numbers" for entry/exit and have let emotion take over. Well, this seems like one of those times when we either end up catching the "falling knife" or miss out on some solid hard to find gains. Hard to make any money in the G. NAAIM numbers don't look good. Love your insights. Keep'm coming...
EJJ
Hi ShitePoke,
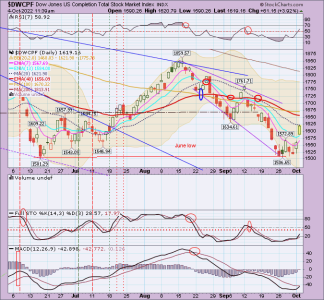
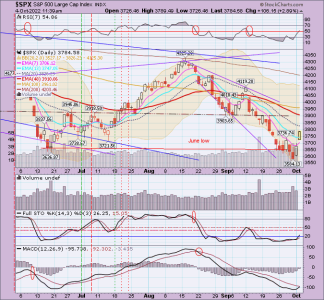
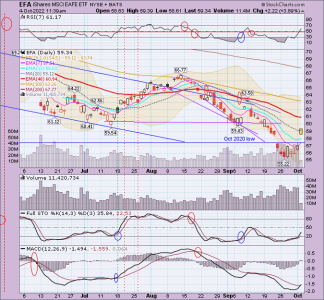
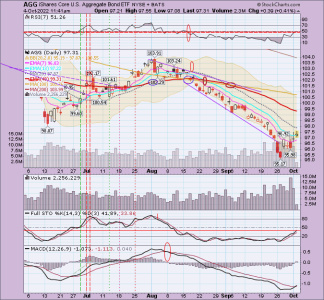
My current Bear strategy involves trying to avoid whipsaws by not going in too early in this overall short-term Bear market. Assumption is that any increases are likely just temporary short-term bounces; although those bounces can be quick and quite large. Keep in mind, on my " lined" charts I show the strategy entry and exit points designated with vertical lines: Green for entry and RED for exit. The First red dotted vertical line is where I reduce exposure and 2nd Red line is full exit. Sometimes I do not execute due to my own fear and because I am still testing this strategy. I do plan to execute the next time parameters hit.
Entry - generally want RS-7 above 50, MACD above its signal line, Slow Stochastic above its signal line going over 20 but better yet wait until Slow Sto gets above whipsaw zone of 45 or so, which I set based on recent observations earlier this year.
Exit - generally reduce exposure when RSI-7 touches 70 or Slow Sto touches 80. Full exit when RSI-7 drops below 70 or Slow Sto drops below 80 or start to see MACD forming flat head or weaving with its signal line. Consider staying in if you see lots of white space between MACD and its signal line. Also consider if you will reduce and exit based on whether you want chance to reserve your 2nd IFT for later re-entry in current month.
These are fairly conservative parameters in my opinion.
Please do not take any of this as trading advice. I am not a professional by any means...just trying to get by and using my own observations and strategies to trade my retirement account. I also show the 13 and 48 EMA so anyone liking that long term crossover strategy can use it. Also, just following a MACD crossover as entry/exitsfor long term strategy is also very good! I definitely keep an eye on that. Best wishes to you! :smile:
Last edited:
DreamboatAnnie
TSP Legend
- Reaction score
- 833
DreamboatAnnie
TSP Legend
- Reaction score
- 833
LTJPFED, Thank you so much for your very kind compliment! Wish I could make those charts move up. Best wishes to you and everyone*! :smile:
felixthecat
Analyst
- Reaction score
- 41
- AutoTracker

Nice charting DB! You have been right on the money. So dangerous if one was trying to catch these dead cat bounces within the overall negative sentiment of a possible market panic at these levels. The downtrend has remained intact as investors begin to price in a deeper and longer recession. Oh boy, that inflation isn't budging ( https://www.clevelandfed.org/our-research/indicators-and-data/inflation-nowcasting.aspx ) and neither is the job market showing strength. Just goes to show...the FED has more to do at the expense of the stock market. The FEDS fund rate is still too low (3.25 or so) and that is not helping to curb inflation at all. FED not serious although they talk it. It should be near 7 percent right now. FED caught in a real dilemma...bring funds rates up faster and kill inflation at the expense of the stock market which is on the precipice of a real market Black Monday like panic with more aggressive fed moves. Even with all the negative views...still believe a new bull market will begin next year in the spring. Until then, ugly can get uglier. The world economies don't look good either...with the FED likely to wreck ours before the turnaround in the stock market begins. 
DreamboatAnnie
TSP Legend
- Reaction score
- 833
DreamboatAnnie
TSP Legend
- Reaction score
- 833
DreamboatAnnie
TSP Legend
- Reaction score
- 833
DreamboatAnnie
TSP Legend
- Reaction score
- 833
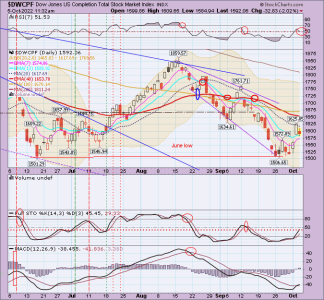
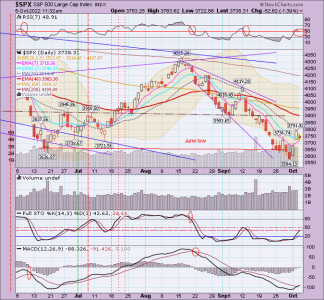
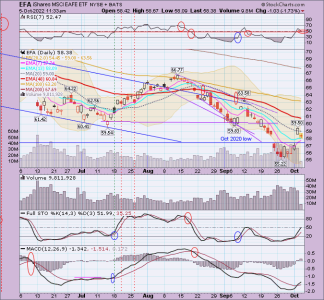
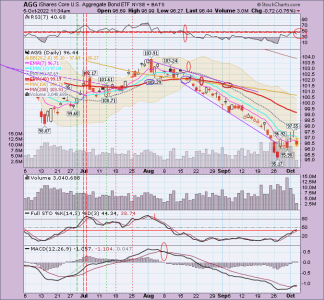
Rollercoaster! So close to hitting entry parameters but again, not today. RSI needs to turn back up, SlowSto needs to get just above whipsaw zone... Good thing is MACD has crossed positive and that is a very good milestone. Best wishes to everyone! :smile: P.S. I will not be posting on Friday through Tuesday. Back next Wednesday, but clean charts are per my signature line located at post 4816, page 402.


DreamboatAnnie
TSP Legend
- Reaction score
- 833
Thanks Raven! Lol... Gotta have fun sometimes. Doing some wine tasting and shopping in nearby pretty little town with a few girlfriends plus karaoke, which I love! Should be fun!  .
.

