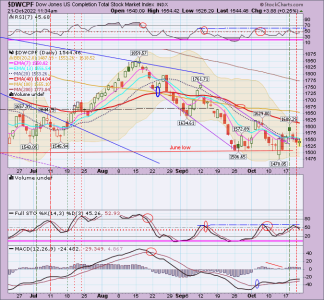
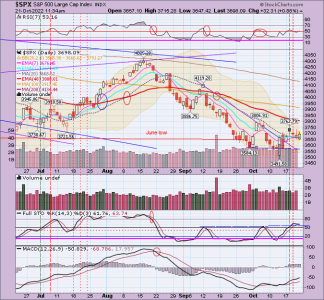
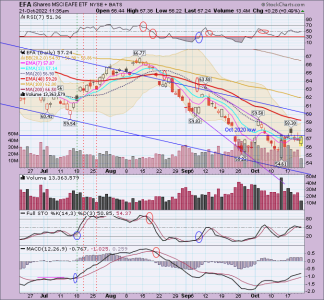
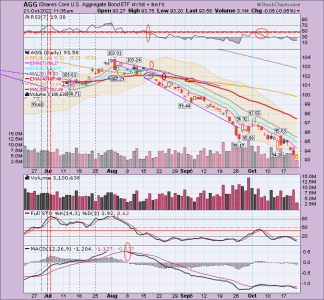
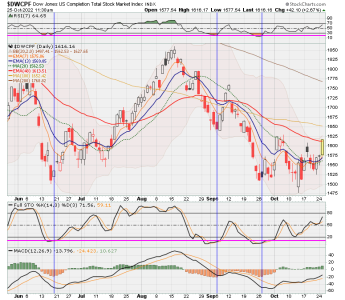
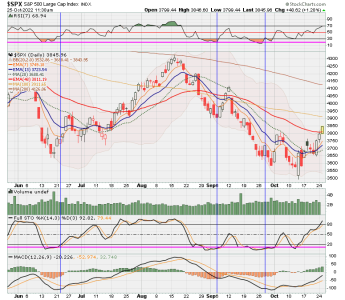
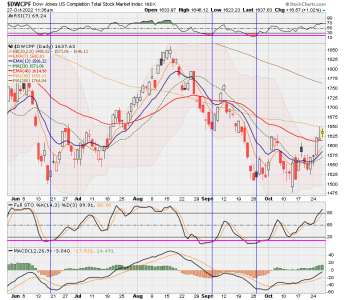
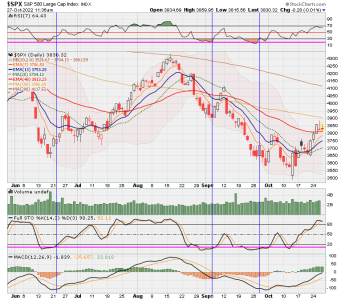
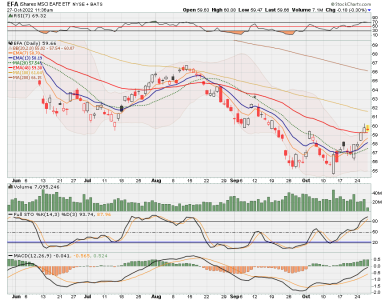
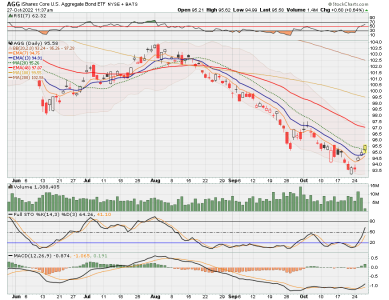
Just to clarify, I am now following my strategy #3.
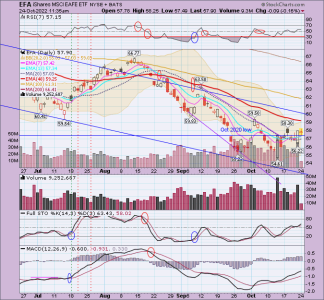
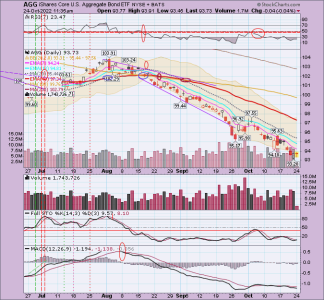
Strategy 1. My charts still display the 13 and 48.5 daily EMAs just in case anyone wants to use these to follow and execute moves based on these crossovers. Many years ago I posted that these EMAs were the best crossover for longer term strategy based on a study I had seen on internet. Moves are minimal. This may need to be updated based on latest studies. I am considering a 3 EMA crossover strategy of 9,21,51 EMAs.
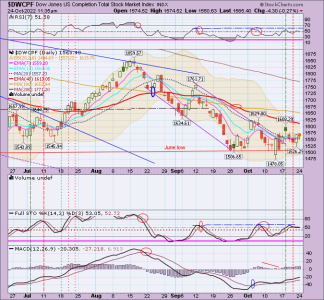
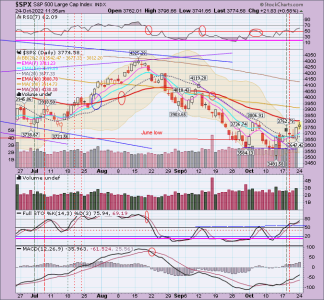
Strategy 2. Since about mid-May I came up with my strategy described at post #4868, page 406, and started testing it because of whipsaws that kicked my buns earlier in the year. In October, I decided that Strategy 2 is not working frequently enough to trigger an entry because market is not having prolonged upswings going beyond the Strategy 2 whipsaw zones. Therefore, I stopped posting charts based on this method and last posted tge detailed charts on Monday.
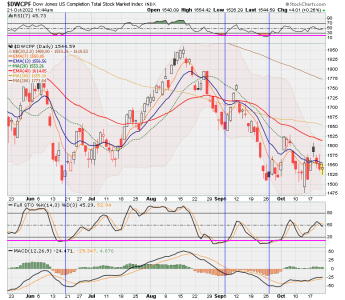
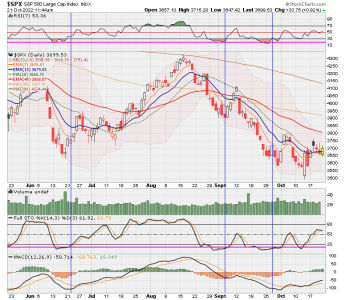
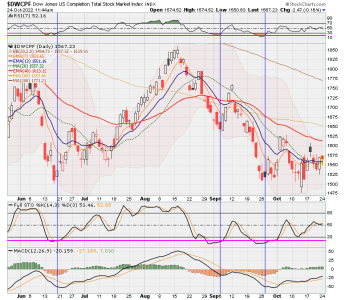
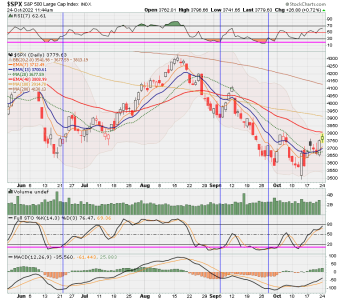
Strategy 3. Started displaying pink line charts on 10/21/22. Decided to use new strategy to enter market only when both Slow Stochastics and RSI drop to the low levels indicated by drawn in Pink Lines. Strategy described at post 4889 & 4894 & 4903.
• Post 4889 says, go in when both RSI and Slow Stochastic get below low levels indicated by my inserted Pink lines and then stay in only a few days, reducing exposure as price gets close to whipsaw zone.
• Post 4894 says, I am particularly looking for Slow Sto to drop below 10 (black line) and be below its signal line (red line) and then starting to rise above its signal line for entry while also looking at RSI to see if it is pointing upward. Will use whipsaw lines to exit or reduce exposure. Note: Also, best to enter after Slo Sto starts to rise back above its signal line.
• Post 4903 says, Blue vertical line marks strategy entry where both pink lines were touched or breached and where both RSI-7 and slow Sto start to rise. I like to see Slow Sto get below 10 and then start to rise before any entry. Exit point is varied....3-5 days after initial entry with RSI reversal a definite exit but possibly longer stay in market (before exit) if MACD gets above its signal line. Still testing this.
Since I am not following strategy 2 any longer, I am now only posting S and C fund charts that show the Pink entry lines of Strategy 3. I will be inserting Green vertical dashed lines when I see entry for this new Strategy 3 from his date onward, and pink and red vertical dashed lines to denote partial and full exits, respectively. Right now, the market is not near hitting the parameters required for strategy 3 entry.

