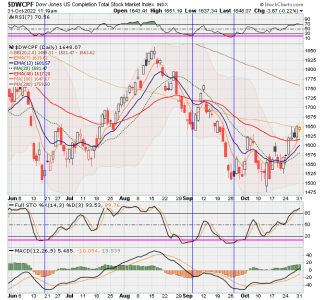
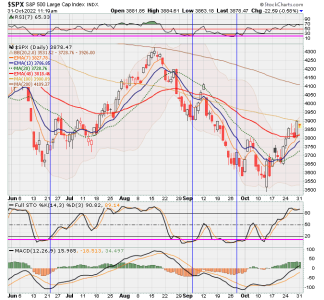
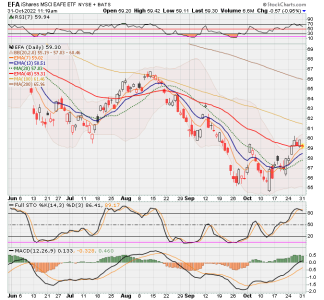
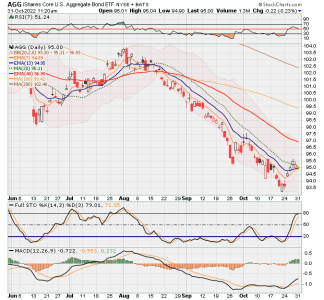
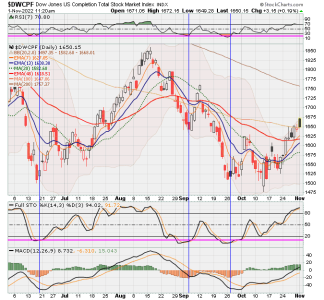
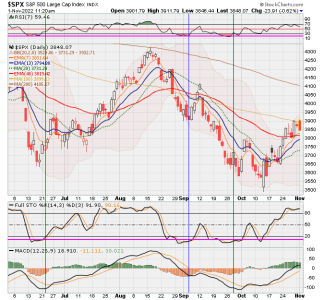
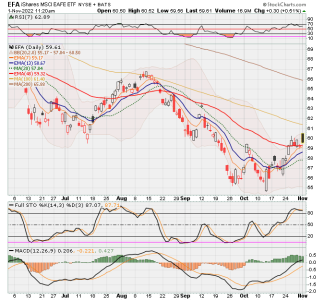
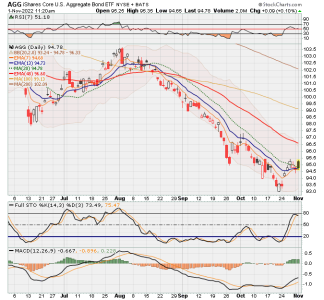
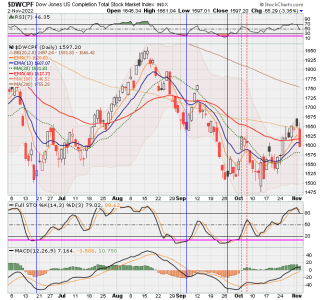
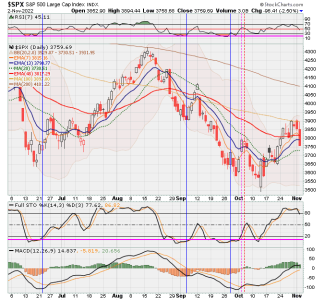
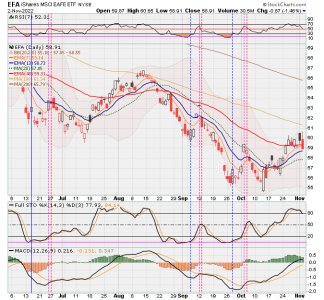
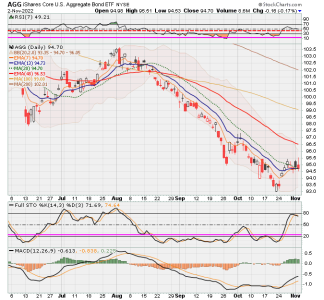
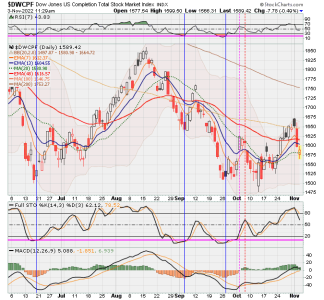
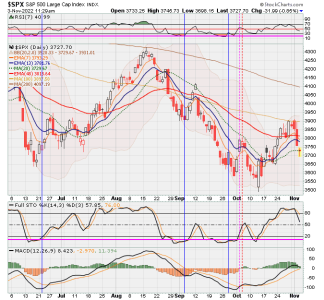
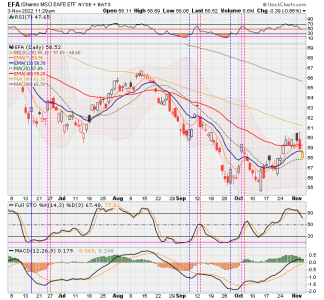
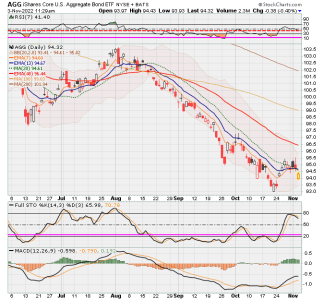
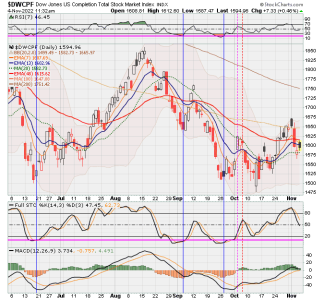
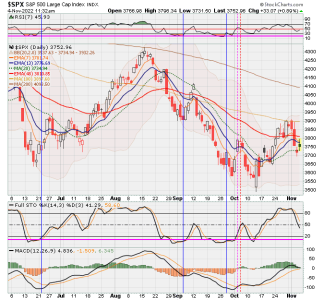
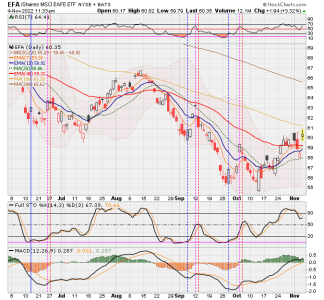
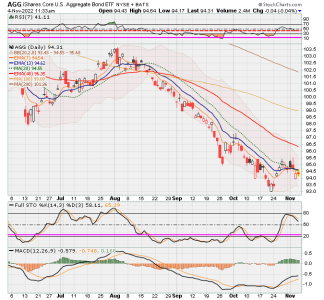
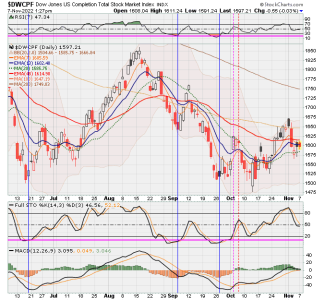
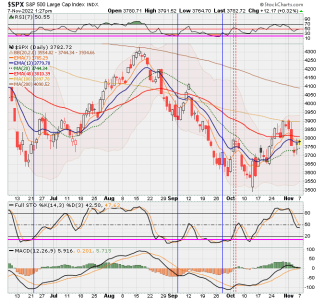
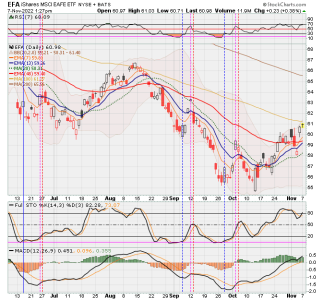
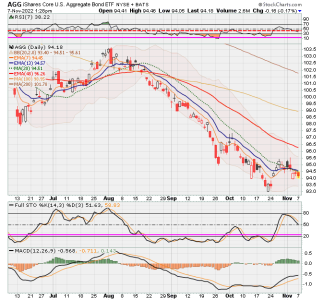
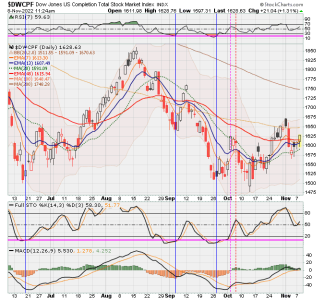
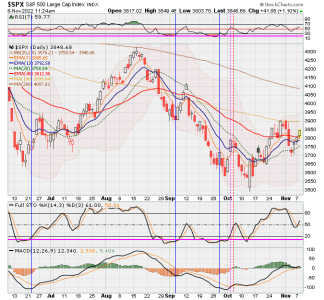
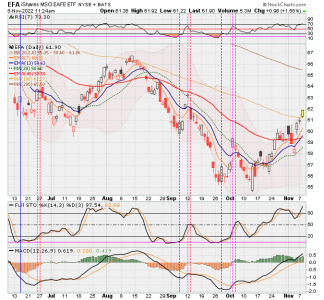
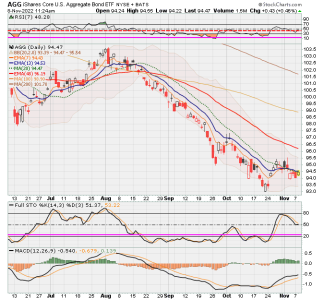
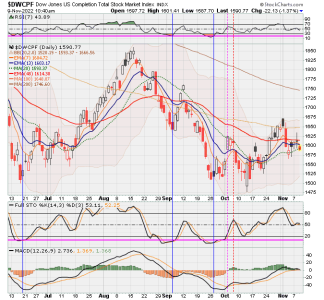
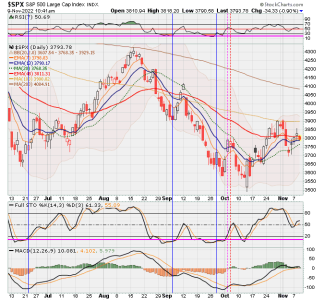
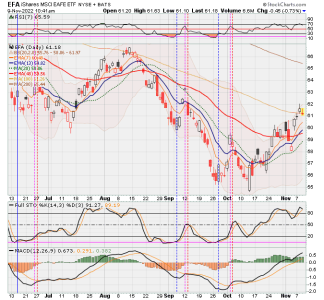
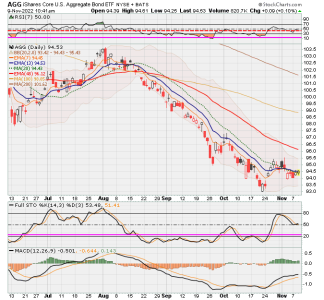
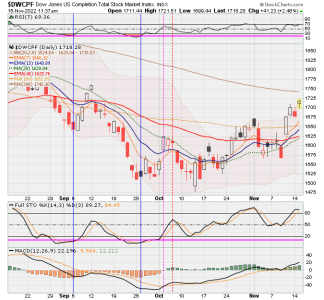
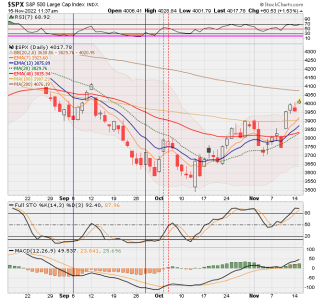
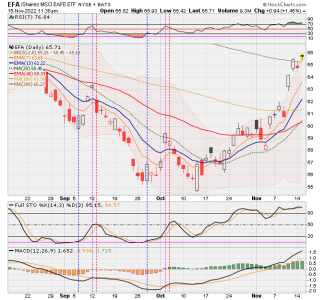
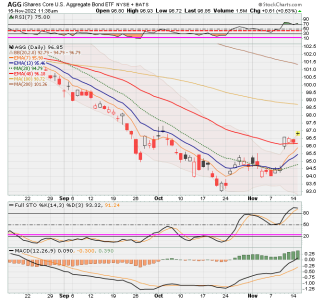
Been busy lately. Trying to keep up with charting. Here are Pink lined Strategy 3 charts.
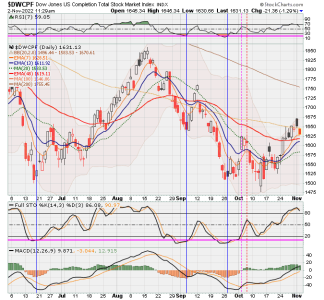
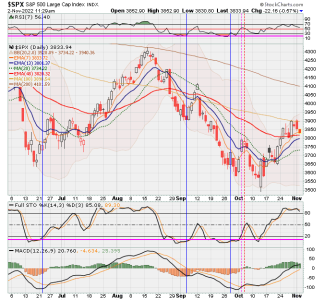
Strategy 3. Started displaying pink line charts on 10/21/22. Blue or Green vertical dashed lines inserted for entry. Pink and red vertical dashed lines to denote partial and full exits, respectively. Enter market only when both Slow Stochastics and RSI drop to the low levels indicated by drawn in Pink Horizontal Lines. Exit point is varied....3-5 days after initial entry with RSI reversal a definite exit but possibly longer--f MACD gets above its signal line but exit if it gets flat headed. Still testing this.
Strategy described at post 4889 & 4894 & 4903.
• Post 4889 says, go in when both RSI and Slow Stochastic get below low levels indicated by my inserted Pink lines and then stay in only a few days, reducing exposure as price gets close to whipsaw zone.
• Post 4894 says, I am particularly looking for Slow Sto to drop below 10 (black line) and be below its signal line (red line) and then starting to rise above its signal line for entry while also looking at RSI to see if it is pointing upward. Will use whipsaw lines to exit or reduce exposure. Note: Also, best to enter after Slo Sto starts to rise back above its signal line.
• Post 4903 says, Blue [and now Green] vertical line marks strategy entry where both pink [horizontal] lines were touched or breached and where both RSI-7 and slow Sto start to rise. I like to see Slow Sto get below 10 and then start to rise before any entry. Exit point is varied....3-5 days after initial entry with RSI reversal a definite exit but possibly longer stay in market (before exit) if MACD gets above its signal line. Still testing this.

