Many believe the market is overbought, and technical analysis with charts leads one to a similar conclusion. So, what are institutions and the heavytraders, and perhaps others, as compared to the broad market, buying lately? To find out, I show several relationship charts. A relationship chart compares an individual stock against the broader market. For this exercise I am focusing on consumer staples because, if the market is topping, there should be movement toward stocks that can survive a downturn. We all have to eat, use soap, toothpaste and other essentials; right? Walmart (WAL) at the end of 2012 operated more than 10,000 stores in 27 countries selling staples and food. Safeway (SWY) operated approximately 1678 stores across the US and Canada as primarily a food chain at the end of the year.
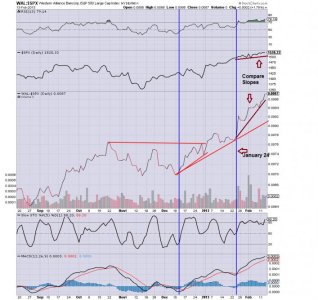
The first chart shows Walmart and the SPX (denoted as WAL:$SPX). They are shown together as a relationship on the line chart and the SPX is also shown by itself in the panel above the main chart. You can see starting on January 24, 2013 and following, the slope on the WAL:$SPX increased substantially as compared to the SPX. The MACD histogram was ticking up towards and then crossing the zero line, which is a sign of strength.
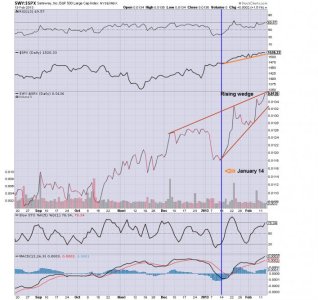
The second chart shows Safeway and the SPX. Again they are shown as a relationship on the line chart (denoted as SWY:$SPX) and the SPX is also shown by itself in the panel above the main chart. In this case the recent steep move started on January 14, 2013 when the MACD histogram and the stochastic started to tick up. Again the slope of SWY:$SPX is much steeper than just the $SPX.
The staples (XLP) sector ETF shows a similar pattern, steepening more in early February, but backing down a little now. Of course this is just a small sample, and one would need to look at many more charts. At any rate the institutions, which are widely believed to control the markets, are buying these staples in disproportion to the broad market. So either they are hedging against the persistent bull market or just like these stocks.
To be fair these charts also show a current overbought RSI and stochastic, and the rising wedge on Safeway. XLP peaked in early February and is declining as compared to the SPX as well. So, is risk back on? We will soon find out.


