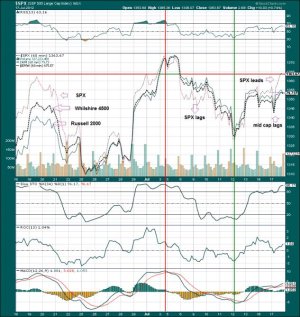
Today was a wild one; down, up and a slow grind kind of session. Below I show the 500 large Capitalization stocks as SP 500 ($SPX), Mid-Small Capitalization stocks as Whilshire 4500 ($EMW) and Small Capitalization stocks as Russell 2000 (IWM), in a 60 minute chart for the last month. Notice how they have been changing places. Between the June 18-25 periods, large cap was leading followed by mid cap and small cap. On the vertical ascent on June 29[SUP]th[/SUP] they all blended together. After the 4[SUP]th[/SUP] of July, during the next week, the trio became inverted with small cap leading and large cap lagging. And today (Tuesday, July 17), we saw another alignment with large cap leading, small cap second and mid cap lagging. In fact 115 in millions were sold in block trades as Mid-Cap (IWR) and 60 in millions as Small-Cap (IWM) today. So, the institutions are reducing their position sizes. Why? One hypothesis may be that institutions are cycling between sectors and capitalization. Another reason may be that institutions fear something, like the soft patch growing deeper. Institutions can’t act real fast; as it takes them longer than the small retail investor to unload small and mid-cap stocks at a favorable price. This is because the trading volume is thinner on the myriad of these stocks they hold. Do they see another dip coming and are warning us, while they sell into strength?


