Last week, our sentiment survey was bearish (bullish) as was the AAII survey. I was anticipating the market would bias higher for the week, but geopolitical headwinds helped to trump that outcome. Volume is low, seasonality is negative and liquidity has been weak. Our sentiment survey did see a few more bears and a few less bulls for next week and that is moderately bullish. But AAII showed a move from bearish to neutral with a lot fewer bears and that doesn't help. I note that the Syrian situation may be beginning cool off and that could help settle the market down. But September is historically the weakest month of the year too, so that's something to keep in mind.
Here is this week's tracker charts:

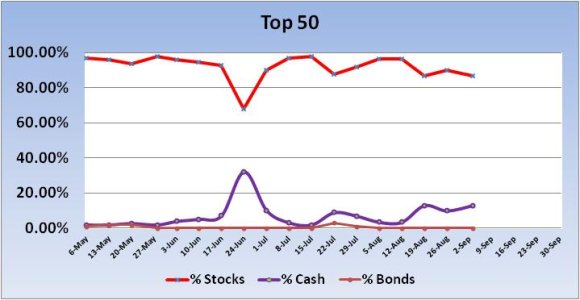
No signal from the Top 50 this week. For the new trading week, total stock allocations dipped by 3% to a total stock allocation of 87%. I think this is still bullish longer term.

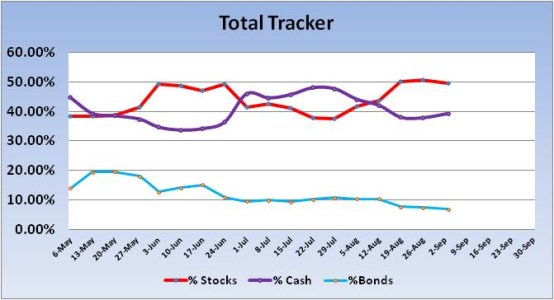
No signal was generated from the Total Tracker this week. Total stock allocations dipped by 1.0% to a total allocation of 49.54%, which is still a conservative allocation in a bull market, so I view this as bullish in the longer
term.

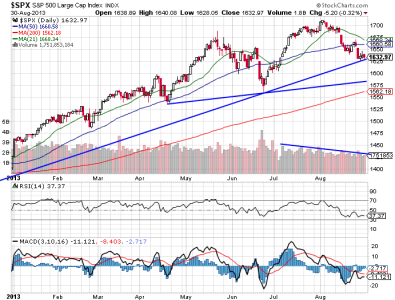
The S&P 500 fell back below its 50 day moving average last week and is dancing along support and creating a small bear flag in the process. The Head and Shoulders pattern is in play. Note the volume. While we are in a seasonally weak period that often sees low volume, that low volume is also consistent with the head and shoulders pattern. I drew a line along the volume bars to show how volume has fallen off while the head has been forming. Volume is usually higher on the left shoulder in this pattern and falls off as the head forms. You can see that’s the case here. I would think the neckline would require price to fall to trend line support in the 1585 area, but it doesn't have to play out that way. Still, that is a real possibility. The relative strength index is weak and MACD remains negative. The 21 day moving average is getting close to crossing the 50. This is not a bullish chart at the moment.
To see this week's full analysis, follow this link http://www.tsptalk.com/members/
Here is this week's tracker charts:

No signal from the Top 50 this week. For the new trading week, total stock allocations dipped by 3% to a total stock allocation of 87%. I think this is still bullish longer term.

No signal was generated from the Total Tracker this week. Total stock allocations dipped by 1.0% to a total allocation of 49.54%, which is still a conservative allocation in a bull market, so I view this as bullish in the longer
term.

The S&P 500 fell back below its 50 day moving average last week and is dancing along support and creating a small bear flag in the process. The Head and Shoulders pattern is in play. Note the volume. While we are in a seasonally weak period that often sees low volume, that low volume is also consistent with the head and shoulders pattern. I drew a line along the volume bars to show how volume has fallen off while the head has been forming. Volume is usually higher on the left shoulder in this pattern and falls off as the head forms. You can see that’s the case here. I would think the neckline would require price to fall to trend line support in the 1585 area, but it doesn't have to play out that way. Still, that is a real possibility. The relative strength index is weak and MACD remains negative. The 21 day moving average is getting close to crossing the 50. This is not a bullish chart at the moment.
To see this week's full analysis, follow this link http://www.tsptalk.com/members/
