Not much action for Week-12.
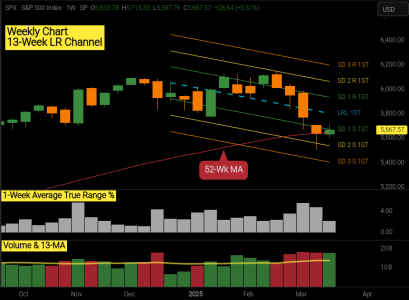
At 2.08% the Average True Range was the lowest of the past 14 weeks, giving us less than half than each of the previous 2 weeks.
Volume was on par with the previous 3 weeks, but it's a bit deceptive as Friday's Options Expiration gave us 35% of the week's volume.
___Excluding Friday, Mon-Thur's volume was (on average) 20% lower than the previous week, perhaps it's a clue the selling has subsided?
___On Monday we may see some heavier than normal volume correlated with Quarterly expiration.
The good news, we did get a higher weekly high/low and broke the 4-Week losing streak.

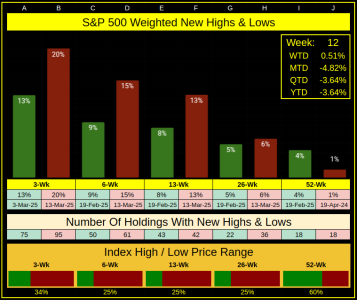
Across the various timeframes and price ranges, sellers are still outpacing buyers, but this week we did see selling momentum slow down.

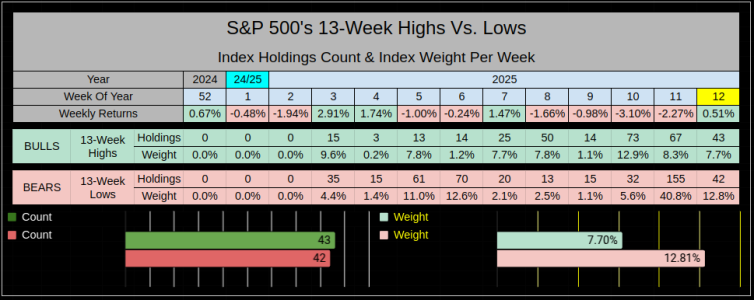
On the 13-Week timeframe, for Week-12 the holdings count was nearly identical at 43-Bulls Vs. 42-Bears.
In the previous Week-11, by weight sellers outpaced buyers by 32.5%. For Week-12 the sellers edge was much smaller at 5.1%

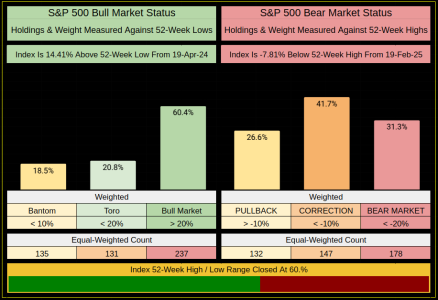
Week-12 shows us a weighted 31.3% of the Index is < -20% off its 52-Week Highs. It's not great, but the previous Week-11 was 31.4% so in reality there wasn't much movement across the index. It's only fair to also consider a weighted 60.4% of the index is > 20% off its 52-Week Lows and the index is at 60% of it's high/low range.

Thanks for reading, have a great week...Jason
At 2.08% the Average True Range was the lowest of the past 14 weeks, giving us less than half than each of the previous 2 weeks.
Volume was on par with the previous 3 weeks, but it's a bit deceptive as Friday's Options Expiration gave us 35% of the week's volume.
___Excluding Friday, Mon-Thur's volume was (on average) 20% lower than the previous week, perhaps it's a clue the selling has subsided?
___On Monday we may see some heavier than normal volume correlated with Quarterly expiration.
The good news, we did get a higher weekly high/low and broke the 4-Week losing streak.

Across the various timeframes and price ranges, sellers are still outpacing buyers, but this week we did see selling momentum slow down.

On the 13-Week timeframe, for Week-12 the holdings count was nearly identical at 43-Bulls Vs. 42-Bears.
In the previous Week-11, by weight sellers outpaced buyers by 32.5%. For Week-12 the sellers edge was much smaller at 5.1%

Week-12 shows us a weighted 31.3% of the Index is < -20% off its 52-Week Highs. It's not great, but the previous Week-11 was 31.4% so in reality there wasn't much movement across the index. It's only fair to also consider a weighted 60.4% of the index is > 20% off its 52-Week Lows and the index is at 60% of it's high/low range.

Thanks for reading, have a great week...Jason
