Cactus' Account Talk

Thanx for pointing that out, jonfresno. It's a trending system alright but it's different from LMBF in that you need to follow the closing prices daily to check for an allocation change. That might be too much for someone who only wants to check in at the end of the month to find out where to IFT their funds. I'll still check it out with our C & F Funds when I get some time.

It's strange that he is only using closing values instead of some kind of moving average. I guess that is for ease of computability. Using an 85-day lookback value also seems odd. Why not use 90 days as a mid-term trend? He probably empirically tried several values and published the results for the one that gave him the maximum 10 year return. We can try changing that number too and see what happens.

The major issue for us though is not having more than 2 IFTs a month.

I think there's a chart in there where he used a variety of different values and it seems that 85 days returned the optimal return.

You're right, with 2 IFTs it's tough to be nimble, but there's always the option to go to G fund if you're out of IFTs and it says to switch to bonds. I would think there wouldn't be a lot of switching going on inter-month, but I don't know.
Anyway, I thought you might find it interesting. Neat stuff!
 
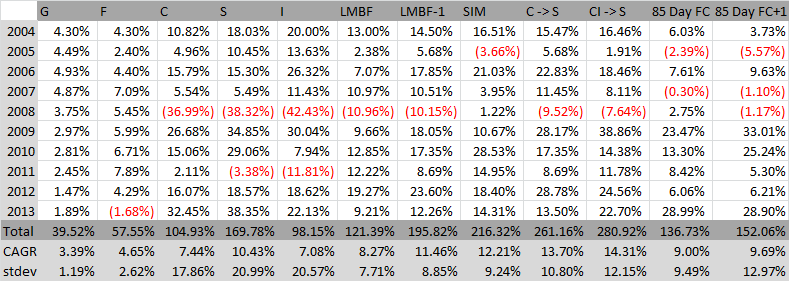
Well I ran the numbers last night on the 85 Day Lookback modified GMR for our C & F Funds including the 1 day IFT lag and here are the 10 year results.

As you can see from the results in the penultimate column, it does produce better results than the C Fund at half the risk (stdev). The author was right about that, even considering the one day lag in our IFTs. But you can't use this with our funds because there are frequently more than 2 IFTs a month -- much more. I've listed the IFT dates below by year. We start off in the C Fund so the first IFT is to F.

2013 1/2
2012 5/21 (5/30,31) 8/10 (8/14,15) 8/28 9/6 (11/19,20) 12/27
2011 6/3 (7/5,6) (7/8,11) 7/18 7/28 12/8
2010 (2/5,8) (2/24/25) (3/1,2) 5/7 (5/13/14) (6/4,7) 6/11 (6/15,16,17) 6/18 9/22 (10/5,6)
2009 (3/27,30) (4/6,7) 4/30 5/7 (5/12,13) 5/15
2008 5/15 (6/5,6) 6/23 (7/18,21)
2007 2/28 3/9 3/14 3/20 (8/6,7) 8/15 10/9 10/16 (12/7,10) 12/26 12/28
2006 (5/23,24) (6/6,7) 6/13 (6/16,19) (6/30,7/3,5) 7/10 (7/12,13) 9/6
2005 (3/30,31) 4/4 4/8 4/14 5/23 6/5 6/14 6/23 (7/14,15,18) 10/12 10/25
2004 5/10 5/13 5/18 6/1 7/2 7/13 (7/22,23) 8/2 (9/20,21) 11/5

The values in parenthasis are two or more back-to-back IFTs. As you can see this method whipsaws our IFTs quite a bit. I tried modifying this method (last column) by waiting until the second day of a signal before generating an IFT. This removed many of the whipsaw trades and actually increased our total gain. That's enough to show us that whipsaws do hurt us. Unfortunately we still end up with more than 2 IFTs a month, so this is still not a viable method.

Even if this method were workable within our IFT limits, it still produces worse results than any of the LMBF-1 family. That, and the fact that LMBF-1 is easier to compute and follow leaves me not interested in pursuing this new method any further.

They can't all be winners.
 

Attachments

  • 85DayLookback.png
    85DayLookback.png
    30.3 KB · Views: 126
Well I ran the numbers last night on the 85 Day Lookback modified GMR for our C & F Funds including the 1 day IFT lag and here are the 10 year results.

As you can see from the results in the penultimate column, it does produce better results than the C Fund at half the risk (stdev). The author was right about that, even considering the one day lag in our IFTs. But you can't use this with our funds because there are frequently more than 2 IFTs a month -- much more. I've listed the IFT dates below by year. We start off in the C Fund so the first IFT is to F.

2013 1/2
2012 5/21 (5/30,31) 8/10 (8/14,15) 8/28 9/6 (11/19,20) 12/27
2011 6/3 (7/5,6) (7/8,11) 7/18 7/28 12/8
2010 (2/5,8) (2/24/25) (3/1,2) 5/7 (5/13/14) (6/4,7) 6/11 (6/15,16,17) 6/18 9/22 (10/5,6)
2009 (3/27,30) (4/6,7) 4/30 5/7 (5/12,13) 5/15
2008 5/15 (6/5,6) 6/23 (7/18,21)
2007 2/28 3/9 3/14 3/20 (8/6,7) 8/15 10/9 10/16 (12/7,10) 12/26 12/28
2006 (5/23,24) (6/6,7) 6/13 (6/16,19) (6/30,7/3,5) 7/10 (7/12,13) 9/6
2005 (3/30,31) 4/4 4/8 4/14 5/23 6/5 6/14 6/23 (7/14,15,18) 10/12 10/25
2004 5/10 5/13 5/18 6/1 7/2 7/13 (7/22,23) 8/2 (9/20,21) 11/5

The values in parenthasis are two or more back-to-back IFTs. As you can see this method whipsaws our IFTs quite a bit. I tried modifying this method (last column) by waiting until the second day of a signal before generating an IFT. This removed many of the whipsaw trades and actually increased our total gain. That's enough to show us that whipsaws do hurt us. Unfortunately we still end up with more than 2 IFTs a month, so this is still not a viable method.

Even if this method were workable within our IFT limits, it still produces worse results than any of the LMBF-1 family. That, and the fact that LMBF-1 is easier to compute and follow leaves me not interested in pursuing this new method any further.

They can't all be winners.
Once again, thanks so much for running the numbers. Def. not a winner for Feds, but hey, it beats the S&P - after all, most funds don't, but as you stated, why would you go against a system that has better returns and is easier to follow?

Thanks again, your calculating prowess is much appreciated!
 
This information used to be available on tsp.gov. Now all I can find is a PDF document with outdated (Jan 2013) numbers.

Here are the changes being made to the L fund allocations:

L2050 Fund
Current Allocation: April 2014 Allocation:

  • G Fund: 10.8% G Fund: 10.68%
  • F Fund: 2.70% F Fund: 3.07%
  • C Fund: 42.60% C Fund: 42.50%
  • S Fund: 18.30% S Fund: 18.25%
  • I Fund: 25.60% I Fund: 25.50%
L2040 Fund
Current Allocation: April 2014 Allocation:

  • G Fund: 18.8% G Fund: 18.78%
  • F Fund: 4.70% F Fund: 4.97%
  • C Fund: 38.60% C Fund: 38.50%
  • S Fund: 16.30% S Fund: 16.25%
  • I Fund: 21.60% I Fund: 21.50%
L2030 Fund
Current Allocation: April 2014 Allocation:

  • G Fund: 28.48% G Fund: 28.53%
  • F Fund: 5.02% F Fund: 5.22%
  • C Fund: 34.60% C Fund: 34.50%
  • S Fund: 12.60% S Fund: 12.50%
  • I Fund: 19.30% I Fund: 19.25%
L2020 Fund
Current Allocation: April 2014 Allocation:

  • G Fund: 42.98% G Fund: 43.20%
  • F Fund: 4.77% F Fund: 4.93%
  • C Fund: 28.05% C Fund: 27.87%
  • S Fund: 8.60% S Fund: 8.50%
  • I Fund: 15.60% I Fund: 15.50%
Income Fund
Allocation Does Not Change:

  • G Fund: 74%
  • F Fund: 6%
  • C Fund: 12%
  • S Fund: 3%
  • I Fund: 5%

Changing Allocations for TSP Funds - FedSmith.com

Great stuff, thanks!
 
Thanx on that, weatherweenie. Hmm, I would have thought that would tank the market. I'll never figure out how this news driven stuff works -- better just stick with the charts and trends. :)
 
Whoa -- Look at that spike @ 2PM. Who said what? :blink:
Here's why!
April 9, 2014, 2:00 p.m. EDT
[h=1]Fed dropped jobless target in secret meeting[/h]http://www.marketwatch.com/story/fed-dropped-jobless-target-in-secret-meeting-2014-04-09-1491016
 
Thanx, nnuut. Any guess on how long the spike will last? It will be interesting to see if we get a fade at the end of rthe day.
 
Yep, it does look like it's leveling out at 1865.

No, wait -- it's still going. Watch out for the thud tomorrow.
 
Looks like two thirds of the folks on the AT are currently negative for the year. Now that's sad. :(
 
Well, the S Fund has regained its losses for the month and is basically flat. The question is: which way is it going to go from here? I think oversold rally has just about run its course and there isn't much left in it. I certainly wouldn't be jumping in here if I were out. With the volatility we've been having lately I don't see it consolidating here either. With the 200 DMA just overhead I can see it bouncing off of that and heading back down for a spell. The question is when and for how long?
 
http://www.tsptalk.com/mb/members-account-talk/21384-doom-trading-system.html#post476026

OK, it's now time for the moment of truth. What is it today? I calculated CRAP from the beginning of the year using the previous equity/safety allocation. Here they are up through yesterday, October 28:
Cactus: -7.63%
CRAP: 19.92%
Looks like CRAP is #2 on the AT.

too funny! crap is #2? the humor is not lost on me.

i likes me a good contrarian indicator.

please continue to maintain and share crapsys.

p.s. shouldn't "cactus' account talk" really be "cactii account talk"? i always get confused about that s thing and the i before e except after c rule.
 
........p.s. shouldn't "cactus' account talk" really be "cactii account talk"? i always get confused about that s thing and the i before e except after c rule.
Cactus ownership is designated with just the apostrophe. Unless Cactus has multiple personalities posting for him, then it would be Cactii's Account Talk.

That second so-called rule has too many exceptions:
beige, cleidoic, codeine, conscience, deify, deity, deign, dreidel, eider, eight, either, feign, feint, feisty, foreign, forfeit, freight, gleization, gneiss, greige,
greisen, heifer, heigh-ho, height, heinous, heir, heist, leitmotiv, neigh, neighbor, neither, peignoir, prescient, rein, science, seiche, seidel, seine, seismic, seize, sheik, society, sovereign, surfeit, teiid, veil, vein, weight, weir, weird
 
Back
Top