Relatively speaking of course. Bullishness is down in our own survey (albeit modestly), but stock allocations are up for the new week.
It seems to me (based on media news items and message board sentiment) that most traders have now gotten the memo that the Fed is going to drive up stock prices (with QE2 and maybe QE3). As a result, fear appears to be slowly disappearing from the market. Remember those big whipsaw events from low to high and vice versa in months past? Mostly gone now. Our appetite for risk is rising. And that seems to be the theme being reflected in our tracker charts.


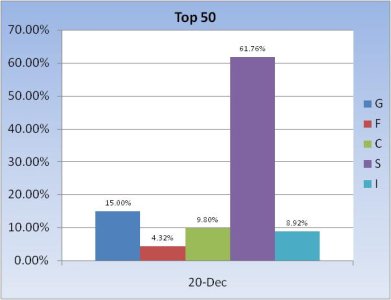
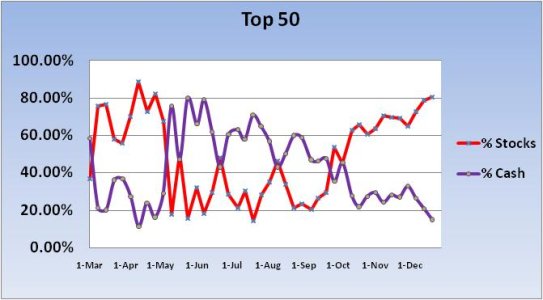
The Top 50 are now showing an overall stock allocation over 80%. I noticed bond exposure ticked up from last week too.


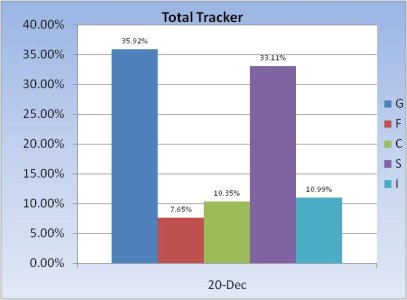
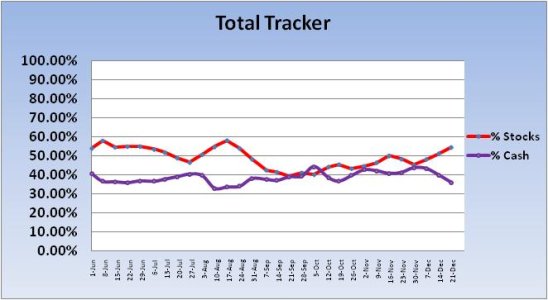
The Total Tracker charts also reflect rising stock allocations with a corresponding drop in cash level. What I find a bit interesting here is that those levels are approaching the same levels from mid-August just before the S&P 500 had its last deep plunge. Are we setting up for a repeat performance? It's possible, but we may need to get past this seasonal period before we know the answer to that question.
For the moment though, it's just something to watch.
It seems to me (based on media news items and message board sentiment) that most traders have now gotten the memo that the Fed is going to drive up stock prices (with QE2 and maybe QE3). As a result, fear appears to be slowly disappearing from the market. Remember those big whipsaw events from low to high and vice versa in months past? Mostly gone now. Our appetite for risk is rising. And that seems to be the theme being reflected in our tracker charts.


The Top 50 are now showing an overall stock allocation over 80%. I noticed bond exposure ticked up from last week too.


The Total Tracker charts also reflect rising stock allocations with a corresponding drop in cash level. What I find a bit interesting here is that those levels are approaching the same levels from mid-August just before the S&P 500 had its last deep plunge. Are we setting up for a repeat performance? It's possible, but we may need to get past this seasonal period before we know the answer to that question.
For the moment though, it's just something to watch.
