Last week, our sentiment survey was on the bearish side with 50% bears. That's a reading that typically sees the market rally the following week. And it did. The wildcard at the time was how politics was going to affect the market as the debt ceiling deadline expired. The market was buying the rumor of a deal early on and once that deal was made the market just kept climbing. We didn't get a "sell the news" reaction. At least not yet.
Now we have sentiment getting bulled up in more than one sentiment survey. Our own survey came in with 58% bulls and 30% bears. Those were big jumps from the previous week when we had 41% bulls to 50% bears. And AAII has continued to see bullishness creep higher too as their survey came in at 46.3% bulls to just 24.9% bears. It's the lack of bears that I'm more focused on and it's on the low side. Just these two surveys alone suggest we'll be seeing some selling pressure next week.
But the data is mixed. And I think it spells volatility. Here's the charts:
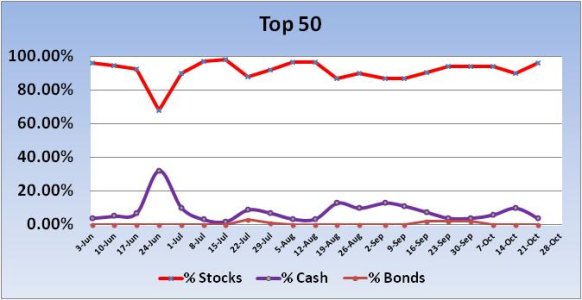
The Top 50 saw stock exposure increase by 5.88% to a total stock allocation of 95.88%. No signal was generated this week.
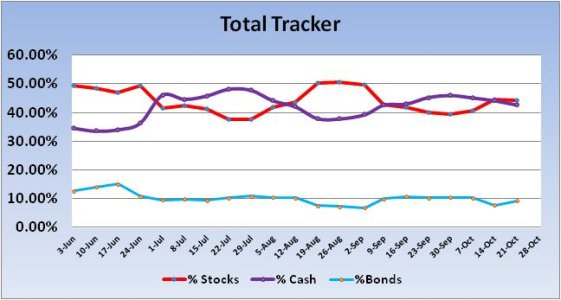
The Total Tracker saw stock allocation dip 0.31%. That's not much, but in 2013 a dip in stock allocations across the auto-tracker has usually meant higher stock prices the following week.
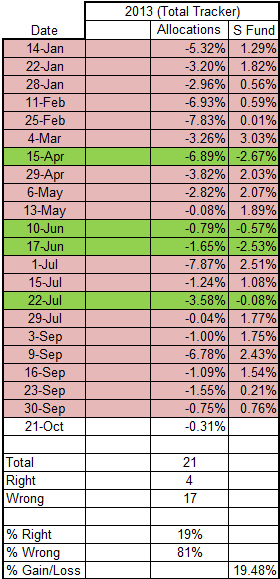
Here are all the weeks in 2013 where we had a weekly decline in stock allocations. This data won't work forever, but market character hasn't changed so this data suggests higher stock prices by the end of next week.
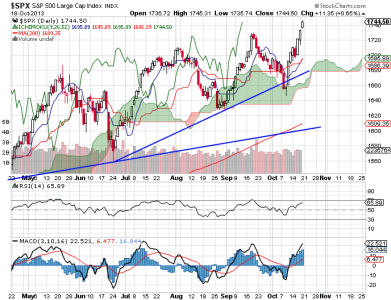
Once again, the move off the bottom from less than 2 weeks ago had legs as the S&P 500 hit fresh all-time highs last week. Technically, the chart looks good, but momentum is quite high and at levels that typically see a reversal or some sideways trading. RSI is not yet indicating an overbought condition, however, so we could see yet more upside.
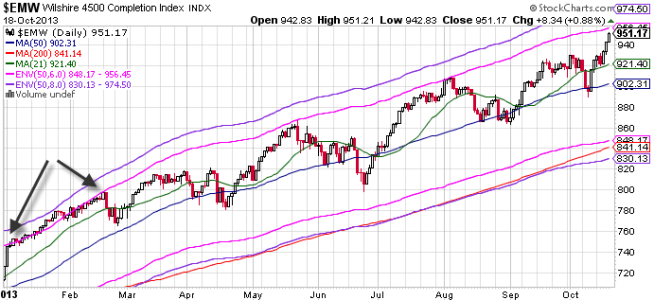
The Wilshire 4500 is nearing a level that has seen pullbacks this year. That level is 6% above the 50 day moving average. You can see in the circled area that there isn't much room left before it tags the top of the pink envelope. You can see the previous two times it reached the 6% mark and you can see weakness followed relatively quickly. Of course, that’s not to say that price can’t keep moving higher. From early January to mid-February price was tracking along and exceeding the 6% level. But in terms of risk, risk is rising for at least some measure of pullback. It’s just a question of when.
As I mentioned earlier, our sentiment survey for this week saw a jump in bulls and a drop in bears, with the bulls coming in at 58%. That’s a bit much and is bearish for the market next week. The AAII survey had a rise in bulls to 46.3% and drop in bears to 24.9%, which I see as a bit bearish for the market given how much it has already advanced. The problem with these bearish readings though is liquidity, which was at very high levels as of late last week. If it remains near current levels, the downside is very likely to remain limited in spite of the extended readings on the charts and bullish sentiment. I'm looking for some volatility to shake out some bulls, but I suspect the market ends the week higher nonetheless. It all depends on liquidity.
Now we have sentiment getting bulled up in more than one sentiment survey. Our own survey came in with 58% bulls and 30% bears. Those were big jumps from the previous week when we had 41% bulls to 50% bears. And AAII has continued to see bullishness creep higher too as their survey came in at 46.3% bulls to just 24.9% bears. It's the lack of bears that I'm more focused on and it's on the low side. Just these two surveys alone suggest we'll be seeing some selling pressure next week.
But the data is mixed. And I think it spells volatility. Here's the charts:

The Top 50 saw stock exposure increase by 5.88% to a total stock allocation of 95.88%. No signal was generated this week.

The Total Tracker saw stock allocation dip 0.31%. That's not much, but in 2013 a dip in stock allocations across the auto-tracker has usually meant higher stock prices the following week.

Here are all the weeks in 2013 where we had a weekly decline in stock allocations. This data won't work forever, but market character hasn't changed so this data suggests higher stock prices by the end of next week.

Once again, the move off the bottom from less than 2 weeks ago had legs as the S&P 500 hit fresh all-time highs last week. Technically, the chart looks good, but momentum is quite high and at levels that typically see a reversal or some sideways trading. RSI is not yet indicating an overbought condition, however, so we could see yet more upside.

The Wilshire 4500 is nearing a level that has seen pullbacks this year. That level is 6% above the 50 day moving average. You can see in the circled area that there isn't much room left before it tags the top of the pink envelope. You can see the previous two times it reached the 6% mark and you can see weakness followed relatively quickly. Of course, that’s not to say that price can’t keep moving higher. From early January to mid-February price was tracking along and exceeding the 6% level. But in terms of risk, risk is rising for at least some measure of pullback. It’s just a question of when.
As I mentioned earlier, our sentiment survey for this week saw a jump in bulls and a drop in bears, with the bulls coming in at 58%. That’s a bit much and is bearish for the market next week. The AAII survey had a rise in bulls to 46.3% and drop in bears to 24.9%, which I see as a bit bearish for the market given how much it has already advanced. The problem with these bearish readings though is liquidity, which was at very high levels as of late last week. If it remains near current levels, the downside is very likely to remain limited in spite of the extended readings on the charts and bullish sentiment. I'm looking for some volatility to shake out some bulls, but I suspect the market ends the week higher nonetheless. It all depends on liquidity.
