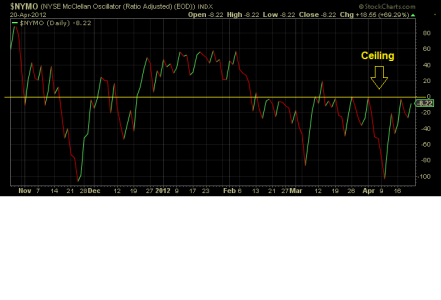
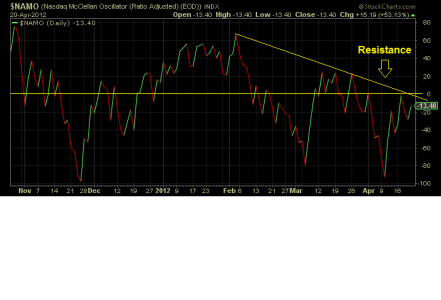
Below are the Near York and Nasdaq McClellan Oscillators. They track the difference between the 19 and 39 exponential moving average ema(s) of daily closes of advances minus declines. The oscillator is ratio adjusted, so that a changing number of issues over time in the markets can be compared. Values below zero are in bearish territory. However, the market can rally when below zero but cannot be sustained for very long; unless a continuation occurs where the zero line is crossed to the upside. Centerline crossovers are bullish, but you can see the NYMO has not been able to get above zero since early February. NAMO is having trouble getting over the zero line and has a divergence line to boot. We are already falling this morning, so it will be interesting to see what happens this week (The chart prints are for Fridays April 20 close).


