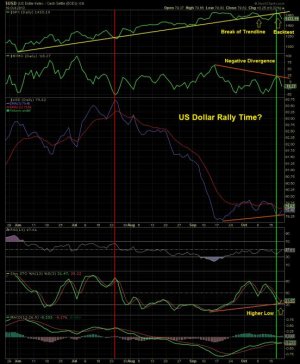
I could be wrong, but the US Dollar (USD) seems like it wants to rally. The evidence is shown on the daily $USD chart below. A flattening of the 13 day exponential moving average (ema) is underway, after a big move down starting in late July. Now the 3 ema has turned up in September and recently made a higher low. Further, the stochastic has turned up from oversold with a higher low, and a recent %K %d cross. The MACD has been above the zero line since September 24. For this rally to be the real deal, we need to see the RSI gain strength and cross 50 and keep going (currently at 47.60). In the upper chart panels, we see the SPX turning down, a break of the trendline with a backtest. Also, there is an obvious lower high on the NYMO since a peak in September, coinciding with the high in the SPX.
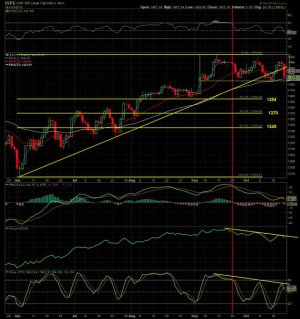
A USD rally should weigh on equities, as the correlation is quite high. The second chart of SPX daily shows possible retracement levels based on the June 1267 low. The levels are 1394, 1370 and 1345 for the standard 38.2, 0.50 and 0.618% retracements. This lines up pretty well with support and resistance zones. I expect a possible first main support area in the 1394-1389 range. Anything can happen, but this is my bet.


A USD rally should weigh on equities, as the correlation is quite high. The second chart of SPX daily shows possible retracement levels based on the June 1267 low. The levels are 1394, 1370 and 1345 for the standard 38.2, 0.50 and 0.618% retracements. This lines up pretty well with support and resistance zones. I expect a possible first main support area in the 1394-1389 range. Anything can happen, but this is my bet.


