-
The Forum works well on MOBILE devices without an app: Just go to: https://forum.tsptalk.com
-
Please read our AutoTracker policy on the IFT deadline and remaining active. Thanks!
-
$ - Premium Service Content (Info) | AutoTracker Monthly Winners | Is Gmail et al, Blocking Our emails?
Find us on: Facebook & X | Posting Copyrighted Material
-
Join the TSP Talk AutoTracker: How to Get Started | Login | Main AutoTracker Page
You are using an out of date browser. It may not display this or other websites correctly.
You should upgrade or use an alternative browser.
You should upgrade or use an alternative browser.
Bquat's Account Talk
- Thread starter Bquat
- Start date
Epic
TSP Pro
- Reaction score
- 366
Your fine.....100%. :biggthumpup:
The fact is we're in an overall Bear Market right now, and most are super cautious at the moment. I know I am for sure. Not too many people "Trusting" of this market. It's easy to get trapped, and then it will break you in half. :worried:
Your charts and commentary are awesome!!! Invaluable stuff.
The fact is we're in an overall Bear Market right now, and most are super cautious at the moment. I know I am for sure. Not too many people "Trusting" of this market. It's easy to get trapped, and then it will break you in half. :worried:
Your charts and commentary are awesome!!! Invaluable stuff.
Bquat
TSP Talk Royalty
- Reaction score
- 757
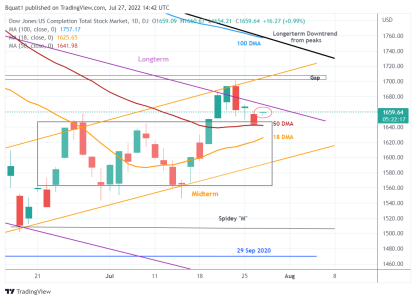
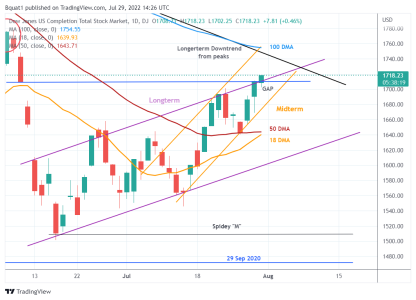
There we go at 1430 Fed says things aren't as bad as thought and will calm down so there's the green candle now. Look at the bottom of this page:I don't trust this. Do you? Not a big green candle acknowledging the confirmed break out. Little Bear: :suspicious:
Bquat
TSP Talk Royalty
- Reaction score
- 757
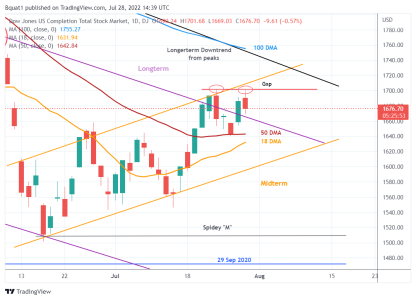
Again the theory of redefining recession seems to be working since because everyone is saying things are getting better or is it the billions that are going to be approved now. So I will watch what happens tomorrow we filled the gap and I am wrong again with my thoughts: :embarrest::embarrest:Starting to clean up the chart for August and may make Midterm Longterm. Double top? Flat top developing? Close enough to gap fill: :blink:
Attachments
Bquat
TSP Talk Royalty
- Reaction score
- 757
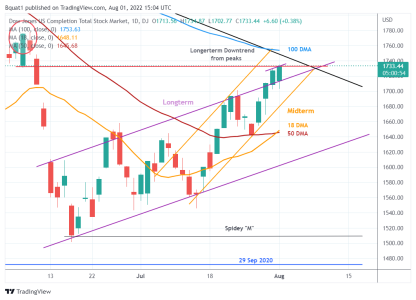
Well the green deal stimulus package may be a done deal. Increased solar panel production and use (China happy), $7500 subsidies for electric cars (Upper class happy), increase tax on natural gas and methane (environmental people happy), increase tax on businesses (progressives happy) and natural gas pipeline for West Virginia (Manchin happy).
Bquat
TSP Talk Royalty
- Reaction score
- 757
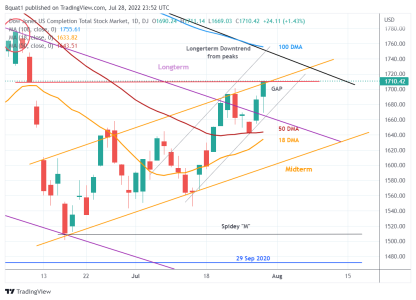
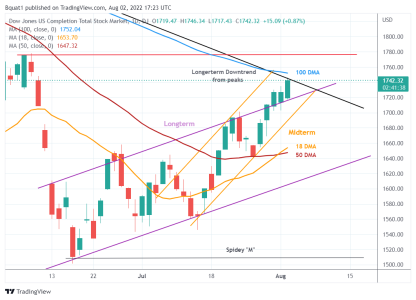
I can't fight the spending spree. Spending with no thought of the future debt. Even the Fed is being fed speaking points. So here's the bullish chart. Maybe a F flag which is bullish until it isn't. Is there strong resistance at the descending peaks line? Watching red line but who can fight the news. Well chart analysis doesn't work for the market anymore and maybe Tom can show the generic (not showing what they were in) monthly gains of the premium services so I can see if they are improving at figuring thing out because they are still showing negative on the autotracker. Well here's my guess for April chart and I don't trust the money pump: :blink::embarrest:Hears a more bullish chart for more stimulus available: :cheesy:

Attachments
Bquat
TSP Talk Royalty
- Reaction score
- 757
This is what the autotracker shows:
[TABLE="width: 40%"]
[TR]
[TD="width: 50%, bgcolor: C1CCFF, align: left"]G-fund[/TD]
[TD="width: 20%, bgcolor: C1CCFF, align: center"]1.41 %[/TD]
[TD="width: 30%, bgcolor: C1CCFF, align: center"]07-29-2022[/TD]
[/TR]
[/TABLE]
[TABLE="width: 40%"]
[TR]
[TD="width: 50%, bgcolor: FFF490, align: left"] RevShark[/TD]
[TD="width: 20%, bgcolor: FFF490, align: center"]-4.82 %[/TD]
[TD="width: 30%, bgcolor: FFF490, align: center"]07-29-2022[/TD]
[/TR]
[/TABLE]
[TABLE="width: 40%"]
[TR]
[TD="width: 50%, bgcolor: C1CCFF, align: left"] Plus_System[/TD]
[TD="width: 20%, bgcolor: C1CCFF, align: center"]-6.95 %[/TD]
[TD="width: 30%, bgcolor: C1CCFF, align: center"]07-29-2022[/TD]
[/TR]
[/TABLE]
[TABLE="width: 40%"]
[TR]
[TD="width: 50%, bgcolor: FFF490, align: left"] F-fund[/TD]
[TD="width: 20%, bgcolor: FFF490, align: center"]-7.86 %[/TD]
[TD="width: 30%, bgcolor: FFF490, align: center"]07-29-2022[/TD]
[/TR]
[/TABLE]
[TABLE="width: 40%"]
[TR]
[TD="width: 50%, bgcolor: C1CCFF, align: left"] C-fund[/TD]
[TD="width: 20%, bgcolor: C1CCFF, align: center"]-12.58 %[/TD]
[TD="width: 30%, bgcolor: C1CCFF, align: center"]07-29-2022[/TD]
[/TR]
[/TABLE]
[TABLE="width: 40%"]
[TR]
[TD="width: 50%, bgcolor: FFF490, align: left"] I-fund[/TD]
[TD="width: 20%, bgcolor: FFF490, align: center"]-14.77 %[/TD]
[TD="width: 30%, bgcolor: FFF490, align: center"]07-29-2022[/TD]
[/TR]
[/TABLE]
[TABLE="width: 40%"]
[TR]
[TD="width: 50%, bgcolor: C1CCFF, align: left"] S-fund[/TD]
[TD="width: 20%, bgcolor: C1CCFF, align: center"]-20.48 %[/TD]
[TD="width: 30%, bgcolor: C1CCFF, align: center"]07-29-2022[/TD]
[/TR]
[/TABLE]
[TABLE="width: 40%"]
[TR]
[TD="width: 50%, bgcolor: FFF490, align: left"] Intrepid_Timer[/TD]
[TD="width: 20%, bgcolor: FFF490, align: center"]-21.40 %[/TD]
[TD="width: 30%, bgcolor: FFF490, align: center"]07-29-2022[/TD]
[/TR]
[/TABLE]
[TABLE="width: 40%"]
[TR]
[TD="width: 50%, bgcolor: C1CCFF, align: left"]G-fund[/TD]
[TD="width: 20%, bgcolor: C1CCFF, align: center"]1.41 %[/TD]
[TD="width: 30%, bgcolor: C1CCFF, align: center"]07-29-2022[/TD]
[/TR]
[/TABLE]
[TABLE="width: 40%"]
[TR]
[TD="width: 50%, bgcolor: FFF490, align: left"] RevShark[/TD]
[TD="width: 20%, bgcolor: FFF490, align: center"]-4.82 %[/TD]
[TD="width: 30%, bgcolor: FFF490, align: center"]07-29-2022[/TD]
[/TR]
[/TABLE]
[TABLE="width: 40%"]
[TR]
[TD="width: 50%, bgcolor: C1CCFF, align: left"] Plus_System[/TD]
[TD="width: 20%, bgcolor: C1CCFF, align: center"]-6.95 %[/TD]
[TD="width: 30%, bgcolor: C1CCFF, align: center"]07-29-2022[/TD]
[/TR]
[/TABLE]
[TABLE="width: 40%"]
[TR]
[TD="width: 50%, bgcolor: FFF490, align: left"] F-fund[/TD]
[TD="width: 20%, bgcolor: FFF490, align: center"]-7.86 %[/TD]
[TD="width: 30%, bgcolor: FFF490, align: center"]07-29-2022[/TD]
[/TR]
[/TABLE]
[TABLE="width: 40%"]
[TR]
[TD="width: 50%, bgcolor: C1CCFF, align: left"] C-fund[/TD]
[TD="width: 20%, bgcolor: C1CCFF, align: center"]-12.58 %[/TD]
[TD="width: 30%, bgcolor: C1CCFF, align: center"]07-29-2022[/TD]
[/TR]
[/TABLE]
[TABLE="width: 40%"]
[TR]
[TD="width: 50%, bgcolor: FFF490, align: left"] I-fund[/TD]
[TD="width: 20%, bgcolor: FFF490, align: center"]-14.77 %[/TD]
[TD="width: 30%, bgcolor: FFF490, align: center"]07-29-2022[/TD]
[/TR]
[/TABLE]
[TABLE="width: 40%"]
[TR]
[TD="width: 50%, bgcolor: C1CCFF, align: left"] S-fund[/TD]
[TD="width: 20%, bgcolor: C1CCFF, align: center"]-20.48 %[/TD]
[TD="width: 30%, bgcolor: C1CCFF, align: center"]07-29-2022[/TD]
[/TR]
[/TABLE]
[TABLE="width: 40%"]
[TR]
[TD="width: 50%, bgcolor: FFF490, align: left"] Intrepid_Timer[/TD]
[TD="width: 20%, bgcolor: FFF490, align: center"]-21.40 %[/TD]
[TD="width: 30%, bgcolor: FFF490, align: center"]07-29-2022[/TD]
[/TR]
[/TABLE]
Epic
TSP Pro
- Reaction score
- 366
I am kind of embarrassed because the only reason I am doing good is because I am not trading at all for a while now.
You say that like it's a Bad thing. It takes a lot of internal strength and focus just to sit there and do Nothing after years of jumping in and out of the market and making good gains with very little or no fear what so ever. It's the hardest habit to break mentally. At least for me it was. Why be embarrassed? You have the Discipline to know when not to play this game and wait patiently for an overall better market opportunity where the odds are more in your favor. Well played !!!

Bquat
TSP Talk Royalty
- Reaction score
- 757
April Chart:I can't fight the spending spree. Spending with no thought of the future debt. Even the Fed is being fed speaking points. So here's the bullish chart. Maybe a F flag which is bullish until it isn't. Is there strong resistance at the descending peaks line? Watching red line but who can fight the news. Well chart analysis doesn't work for the market anymore and maybe Tom can show the generic (not showing what they were in) monthly gains of the premium services so I can see if they are improving at figuring thing out because they are still showing negative on the autotracker. Well here's my guess for April chart and I don't trust the money pump: :blink::embarrest:
Attachments
Similar threads
- Replies
- 2
- Views
- 599