-
The Forum works well on MOBILE devices without an app: Just go to: https://forum.tsptalk.com
-
Please read our AutoTracker policy on the IFT deadline and remaining active. Thanks!
-
$ - Premium Service Content (Info) | AutoTracker Monthly Winners | Is Gmail et al, Blocking Our emails?
Find us on: Facebook & X | Posting Copyrighted Material
-
Join the TSP Talk AutoTracker: How to Get Started | Login | Main AutoTracker Page
You are using an out of date browser. It may not display this or other websites correctly.
You should upgrade or use an alternative browser.
You should upgrade or use an alternative browser.
Bquat's Account Talk
- Thread starter Bquat
- Start date
Bquat
TSP Talk Royalty
- Reaction score
- 803
I only went that much because there is a pump and dump action because someone is trying to form a false bottom here. I did issue a Spidey alert: :worried:I'm surprised you are only 60/40 bear market. :1244:
Bquat
TSP Talk Royalty
- Reaction score
- 803
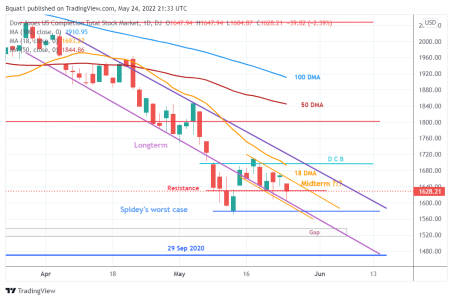
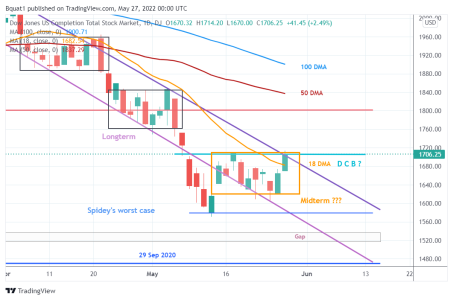
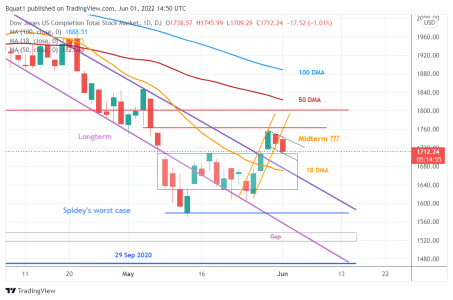
Still trading within the box. Maybe a rally in a downtrend but that 18 day is acting as a magnet.
I still think we might move back down to the bottom of the BB wherever we end up next week. Maybe next day or two we have another small move up with some additional consolidation before we come back down to the bottom. Holiday weekend so I could see light trading tomorrow especially. Perhaps Tuesday we get that turnaround Tuesday, I won't be buying, I can't anyway with TSP shutdown for transactions, but next week could see some confirmation of a change in trend? Or maybe it is another fake out? Who knows. Again nice to make guesses.
I still think we might move back down to the bottom of the BB wherever we end up next week. Maybe next day or two we have another small move up with some additional consolidation before we come back down to the bottom. Holiday weekend so I could see light trading tomorrow especially. Perhaps Tuesday we get that turnaround Tuesday, I won't be buying, I can't anyway with TSP shutdown for transactions, but next week could see some confirmation of a change in trend? Or maybe it is another fake out? Who knows. Again nice to make guesses.
Bquat
TSP Talk Royalty
- Reaction score
- 803

Bquat
TSP Talk Royalty
- Reaction score
- 803
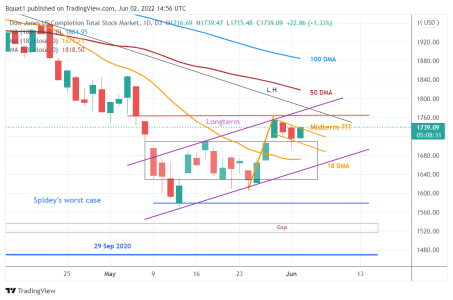
Well, I don't know if things have just really changed but it could have:
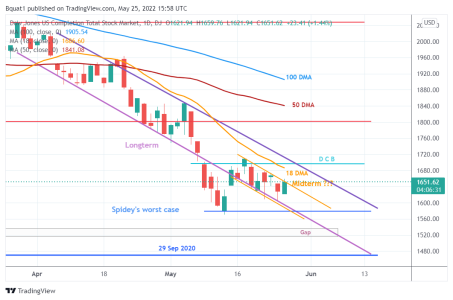
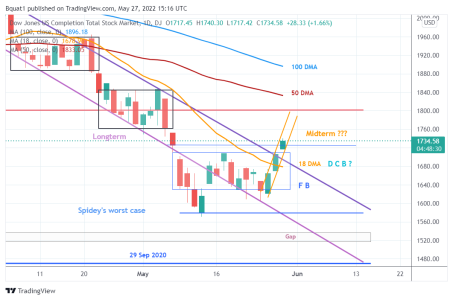
The Three White Soldiers pattern is formed when three long bullish candles follow a DOWNTREND, signaling a reversal has occurred. This type of triple candlestick pattern is considered as one of the most potent in-yo-face bullish signals, especially when it occurs after an extended downtrend and a short period of consolidation.
Just a heads up right when we can't do transfers.
Attachments
Bquat
TSP Talk Royalty
- Reaction score
- 803
Epic
TSP Pro
- Reaction score
- 366
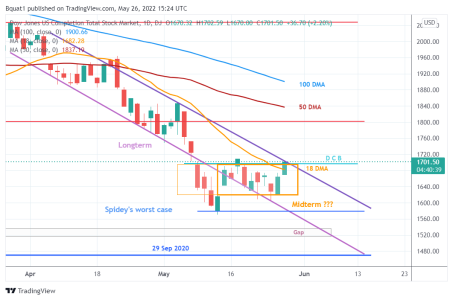
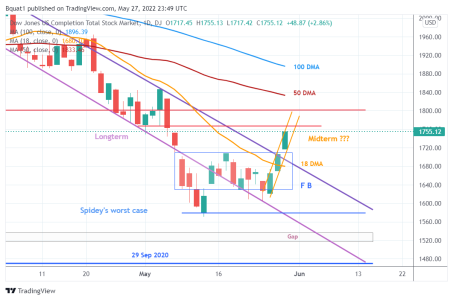
Wish I could make a decent comment, but I'm no charting expert, that's for sure. The only thing that catches my eye is that these patterns are similar but with different volume levels???
Red, Green, Red, Green, Green, Green, Red, Red........
...and with QT starting today, maybe we drill down similar to the beginning of May like before? :dunno: Fill the gap ??

Red, Green, Red, Green, Green, Green, Red, Red........
...and with QT starting today, maybe we drill down similar to the beginning of May like before? :dunno: Fill the gap ??
Pretty good Epic! What's that saying though, once you recognize the trend, the trend changes? Something like that.
I was thinking we would drop back for yet another retest but wasn't sure when. Maybe if we follow the chart pattern we have our answer. IDK.
I was thinking we would drop back for yet another retest but wasn't sure when. Maybe if we follow the chart pattern we have our answer. IDK.
Bquat
TSP Talk Royalty
- Reaction score
- 803
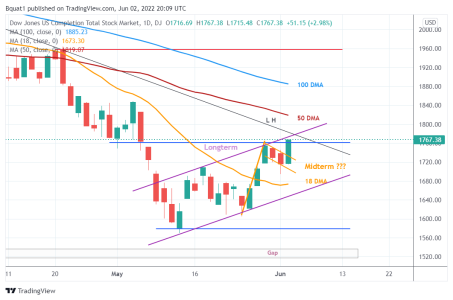
The change was that the green candles were mostly the same size showing a commitment to the up side but it's not continuing to be bullish.Wish I could make a decent comment, but I'm no charting expert, that's for sure. The only thing that catches my eye is that these patterns are similar but with different volume levels???
Red, Green, Red, Green, Green, Green, Red, Red........
...and with QT starting today, maybe we drill down similar to the beginning of May like before? :dunno: Fill the gap ??
View attachment 54524
Bquat
TSP Talk Royalty
- Reaction score
- 803
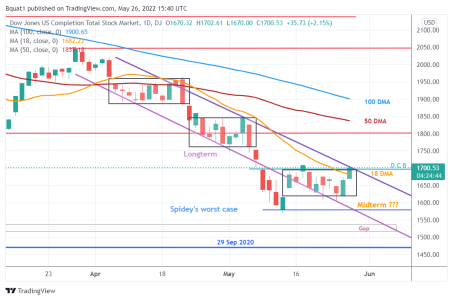
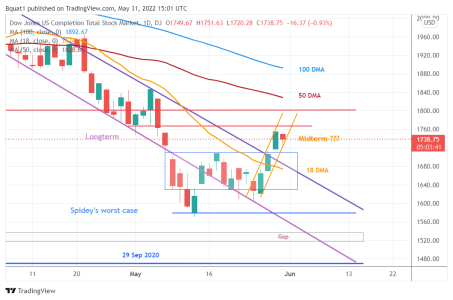
Now what looking better than expected and pile on end of day. Should I bring up the blue line to the bottom of the green candle (left) equal to today's high and turn it red:Working on June chart. Shorter Longterm Bear Flag. Midterm Bull Flag? Just a redraw so far:
Attachments
Similar threads
- Replies
- 2
- Views
- 688