RealMoneyIssues
TSP Legend
- Reaction score
- 101
Why does your link give more results? I like it even though the NuisanceFeeder is still there.
It retrieves all the posts for the last 24 hours (or so), which is why it gets more...
The Forum works well on MOBILE devices without an app: Just go to: https://forum.tsptalk.com
Please read our AutoTracker policy on the
IFT deadline and remaining active. Thanks!
$ - Premium Service Content (Info) | AutoTracker Monthly Winners | Is Gmail et al, Blocking Our emails?
Find us on: Facebook & X | Posting Copyrighted Material
Join the TSP Talk AutoTracker: How to Get Started | Login | Main AutoTracker Page
Why does your link give more results? I like it even though the NuisanceFeeder is still there.
Thanks I'm still looking for a pop that may not come.Thanks for the update Bill! Chart is looking good as always and is much appreciated.
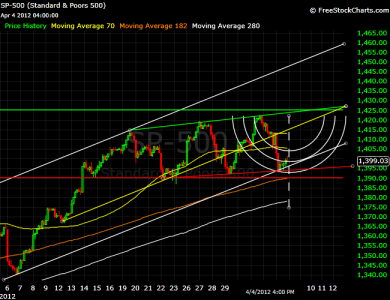
Little Bull is not in agreement with me in drawing the charts with less bullish outlook. He say he is staying bullish and predicts a pop and go to 1450. A pop to 1430 (1.25%) and go to 1450 (1.25%).Now I don't know how he thinks this will happen with the market moving mainly only 1%.:notrust:
I'll belive it when I see it. He thinks shorts will have to cover with a gap up when everyone has a bearish outlook. So I'm just putting it out there as a remote possibility.He's got a bat swinging for a home run. Brought to you by: LittleBullMustbeDreaming.Oscar
Oh well what the ____ contrary this one.
Yea little Bull just went to clean egg off his face.:embarrest: Sorry I was out of pocket this morning and had appointments. Follow up on my kidney stones removal. Don't go back for nine months and get ultrasound then to see if any more are forming.I hope Little Bull is right, but the Nikkei just dropped like a ton of bricks.
Hopefully the good news is that with the sideways movement the market has arrived to the 3 month support line and the 20 day. So let's hold here.I don't think anyone can question the change we've seen in the character of the market. The voracity of the up moves seems to be waning and the drops happening faster and going further (increased volatility).
Still hoping for a bounce but I have my doubts about any mid to long term sustainability of any up move. I noted earlier in the week a flattening of the 5 day MA but the longer term MAs have a little room to go before completely flattening and beginning a dive. Of course by the time they are diving the prices will have sustained appreciable damage.
I'm really pushing for one more visit of the yearly highs. If it happens we'll have a new set of circumstances. If it doesn't, we'll have suffered some losses.
Market has established the blue line as the correction line and has good bounces off of it. So if it don't break, we'll get a break.

Like this notice the blue lines.Bearish Right?Bquat, take the graph back a couple more weeks and you'll notice an ascending wedge, narrowing and closing in to where we are almost now. I too noticed the higher volitility in the highs and lows, instead of the recent stair-stepping.
Additionally, take the S&P out about 15 years and you should notice two tops - July 2000 and October 2007. Note the high volitility before and after those highs - we are about straight out from those shoulder-volitilities, right now.
Coupled with europe (and Spain), China slowing, U.S. housing (and the breaking of the robo-log jam), upcoming questionable U.S. earning - looks pretty dicy - especially from these 2012 lofy levels.
Today, I moved into the I fund thinking the dollar would get some re-adjustment back down; and because of the 4%+ spring. I will, nontheless, have a "quick-pull finger tomorrow and burn the two measly IFTs and be done for April.
