Bquat's Account Talk

Got to go for today. Here's my chart from HopeIDidn'tMakethe WrongChoice.DUH.:worried: I think the bottom of the channel may hold.
 
Ok, let's try this again. I took all my lines off and re-did them with the midterm to short term view (one month). I drew a less bullish current channel in white. Looking at that I see a tripple top and they are still higher highs.:) I saw that my 13 day saved our butts and held. While keeping us from reaching the bottom of the current white channel.:) So I also drew a less bullish 13 day supported channel which is still bullish.:) The rate that we have been going up has been making us think that we're topping. Also my charting has been good and kind of bullish but the market doesn't want to follow it. I should be doing better than I am but the market won't react right to when it's setting new highs lately.:o When it makes a new highs there's no follow through but it still makes new highs. I had gotten out at a dip thinking it would go more down and locked in my loss. Then I was only 50% in on the way back up. I am going to ride and think there's an up move still to come but will it follow what I think it will do? I don't know but I have to follow my charts because why should I do them if I didn't believe I was putting my best guess out there. Thanks guys.
Chart brought to you by: I'mStillBullishNoMatterWhat.Birchism and as always post your contrary posts here also.
 
Just remembered when I got out. I was right after Isreal's prime minister had his speech about being in charge of their own destiny. I had thought the market would react to it like the Libia stuff. I was worried about the market dropping. It will if they attack but the market isn't reacting to it.
 
Little Bull is not in agreement with me in drawing the charts with less bullish outlook. He say he is staying bullish and predicts a pop and go to 1450. A pop to 1430 (1.25%) and go to 1450 (1.25%).:) Now I don't know how he thinks this will happen with the market moving mainly only 1%.:notrust:
I'll belive it when I see it. He thinks shorts will have to cover with a gap up when everyone has a bearish outlook. So I'm just putting it out there as a remote possibility.:confused: He's got a bat swinging for a home run. Brought to you by: LittleBullMustbeDreaming.Oscar

Oh well what the ____ contrary this one.:D

I hope Little Bull is right, but the Nikkei just dropped like a ton of bricks. :sick:
 
I hope Little Bull is right, but the Nikkei just dropped like a ton of bricks. :sick:
Yea little Bull just went to clean egg off his face.:embarrest: Sorry I was out of pocket this morning and had appointments. Follow up on my kidney stones removal. Don't go back for nine months and get ultrasound then to see if any more are forming.

Ok we're at the bottom of the new channel and now what does that mean? We are in a consolidation trading range. Streight sideways movement. Flat tops cause market drops and flat bottoms cause what I don't know.:confused: Oscar is in buy the dips mode and the market in in sell the new tops mode. It does show market weakness. The touch and hold of my 20 Day may be A good thing.:) Well I at my bottom line and holding and maybe we go up from here. The channel is only 2% wide and sideways movement could give us the strenght the market needs and if the channel doesn't hold I'll prabably have to eat this loss. The channel is still supporting higher highs and higher lows. So cross fingers and wait for Birch to return.
 
I don't think anyone can question the change we've seen in the character of the market. The voracity of the up moves seems to be waning and the drops happening faster and going further (increased volatility).

Still hoping for a bounce but I have my doubts about any mid to long term sustainability of any up move. I noted earlier in the week a flattening of the 5 day MA but the longer term MAs have a little room to go before completely flattening and beginning a dive. Of course by the time they are diving the prices will have sustained appreciable damage.

I'm really pushing for one more visit of the yearly highs. If it happens we'll have a new set of circumstances. If it doesn't, we'll have suffered some losses.
Hopefully the good news is that with the sideways movement the market has arrived to the 3 month support line and the 20 day. So let's hold here.
Charts by LineinSand.com
 
Bquat and Mapper,

I like your guys back and forth today...unfortunately I was tied up most of the day and am just getting on here now. Not a very pretty day for the markets, huh? As for Mappers flat-top, one more run to the 1425 area with a fall from there will complete a pattern that will give us a flat line for the top of the year.

My 1409 and 1402 went down the toilet really fast...perhaps too fast. My new downside lines are the 1394 mark and somewhere around the 1383-1386 mark. However, I am very hopeful that, with all this relatively flat movement since the initial drop, that we close above 1402 today and then head for a new high in the near future. If we get that I am probably going to go away for May.

Good luck!
 
Market has established the blue line as the correction line and has good bounces off of it. So if it don't break, we'll get a break.:)
 
Bquat, take the graph back a couple more weeks and you'll notice an ascending wedge, narrowing and closing in to where we are almost now. I too noticed the higher volitility in the highs and lows, instead of the recent stair-stepping.

Additionally, take the S&P out about 15 years and you should notice two tops - July 2000 and October 2007. Note the high volitility before and after those highs - we are about straight out from those shoulder-volitilities, right now.

Coupled with europe (and Spain), China slowing, U.S. housing (and the breaking of the robo-log jam), upcoming questionable U.S. earning - looks pretty dicy - especially from these 2012 lofy levels.

Today, I moved into the I fund thinking the dollar would get some re-adjustment back down; and because of the 4%+ spring. I will, nontheless, have a "quick-pull finger tomorrow and burn the two measly IFTs and be done for April.
 
Market has established the blue line as the correction line and has good bounces off of it. So if it don't break, we'll get a break.:)

Well, the Nikkei is continuing to sink. Down another 1% now after closing down 2.29% yesterday. I fear we are going to be testing deeper levels of support this time. The question is whether to jump out now, or put on the sticky pants.
 
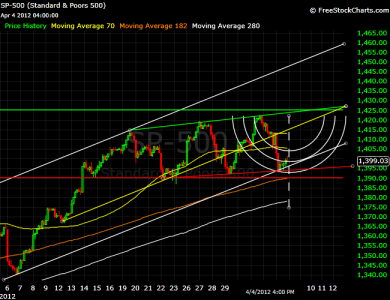
I figured I would give my novice skills a try again. Graphing is graphing to a point I suppose with the technical jargon being different dependent upon what you are charting. My primary Air Force job is Maintenance Analysis and in tech school we did statistics, graphing, trend analysis, etc. so I have some basic fundamentals, but I'm definitely rusty lol. I've attached my stoplight graph (notice the colors) and I had to reuse my trusty ole half pipe (fib arc). :D

I see us from here bouncing back up to the 1425-1428 range before our next drop based on the trend I see. Where I have problems is going back really far and talking about "wedges" like nsurf pointed out. I need to learn these things so I can identify those in the graph.

At least I can hope for a pop to 1425... can't I? :)

April 5.png
 
Bquat, take the graph back a couple more weeks and you'll notice an ascending wedge, narrowing and closing in to where we are almost now. I too noticed the higher volitility in the highs and lows, instead of the recent stair-stepping.

Additionally, take the S&P out about 15 years and you should notice two tops - July 2000 and October 2007. Note the high volitility before and after those highs - we are about straight out from those shoulder-volitilities, right now.

Coupled with europe (and Spain), China slowing, U.S. housing (and the breaking of the robo-log jam), upcoming questionable U.S. earning - looks pretty dicy - especially from these 2012 lofy levels.

Today, I moved into the I fund thinking the dollar would get some re-adjustment back down; and because of the 4%+ spring. I will, nontheless, have a "quick-pull finger tomorrow and burn the two measly IFTs and be done for April.
Like this notice the blue lines.Bearish Right?
 
Market has me a little nervious.:worried: If we can retake my 13 Day and 5 Day, I'll be a happy camper.:)
 
Back
Top