-
The Forum works well on MOBILE devices without an app: Just go to: https://forum.tsptalk.com
-
Please read our AutoTracker policy on the IFT deadline and remaining active. Thanks!
-
$ - Premium Service Content (Info) | AutoTracker Monthly Winners | Is Gmail et al, Blocking Our emails?
Find us on: Facebook & X | Posting Copyrighted Material
-
Join the TSP Talk AutoTracker: How to Get Started | Login | Main AutoTracker Page
You are using an out of date browser. It may not display this or other websites correctly.
You should upgrade or use an alternative browser.
You should upgrade or use an alternative browser.
Bquat's Account Talk
- Thread starter Bquat
- Start date
Bquat
TSP Talk Royalty
- Reaction score
- 716
So, in review why we lost the tug-a-war between Election talking points and real life:
1. Ex FED chairwoman Yellen tried to push that Inflation is transitory and then that it was coming down The rate of rising inflation was decreasing not Inflation itself
2, They had FED chairman Powell say there will be rate cuts Well Consumer Price Index continued up and the other FEDs didn't get the memo
3. It was put out there was going to be a cease fire in Israel No things exoculated increasing the chance of oil production to be affected.
And I was expected an election run up I was wrong
- Reaction score
- 2,456
And I was expected an election run up I was wrong
We might have to wait until June.
This chart only goes up to the 2016 election, but it's over a century's worth of data showing how the Dow Jones performed during an election year.

Bquat
TSP Talk Royalty
- Reaction score
- 716
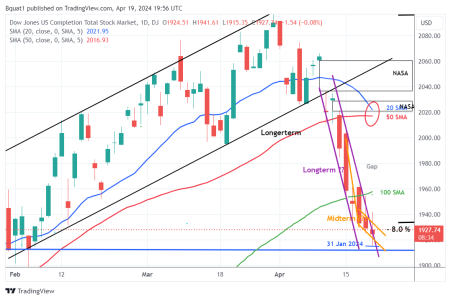
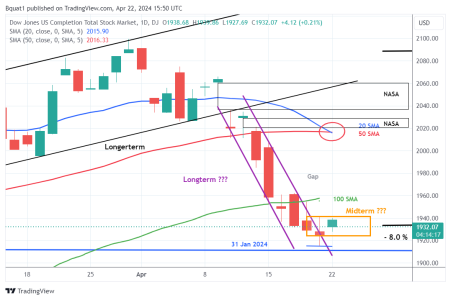
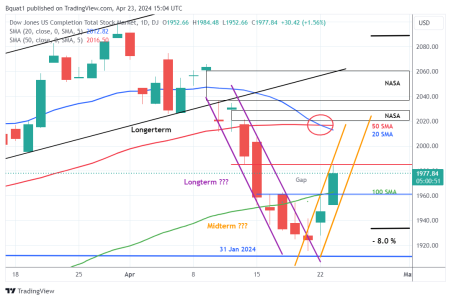
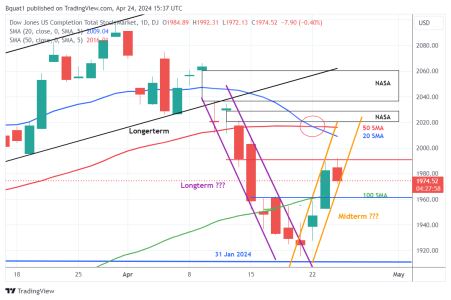
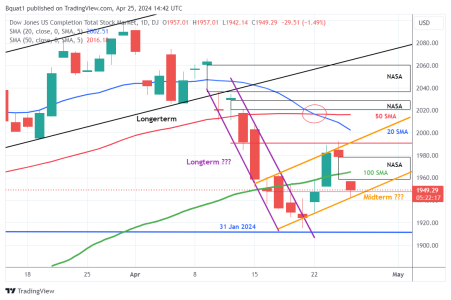
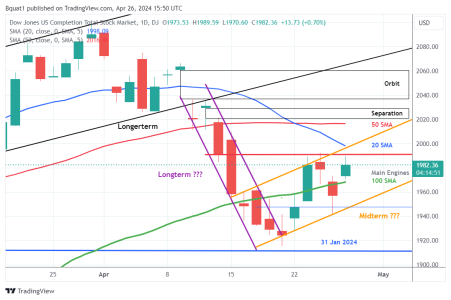
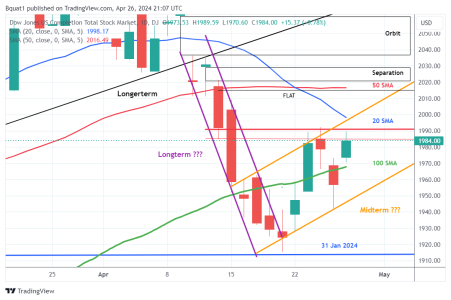
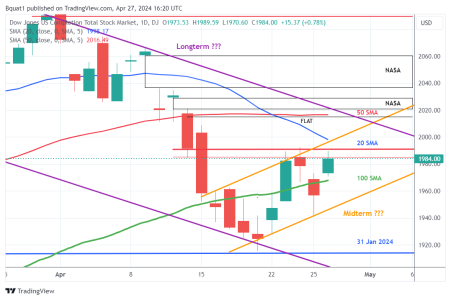
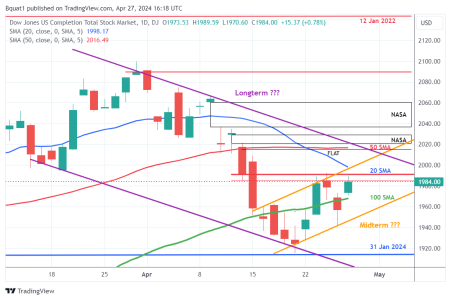
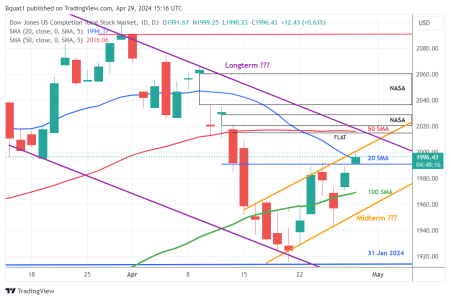
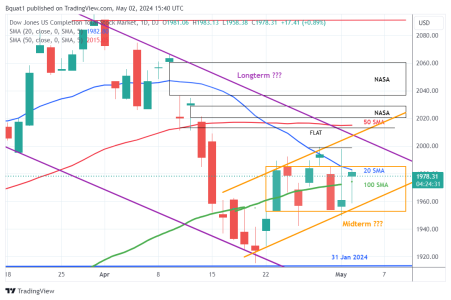
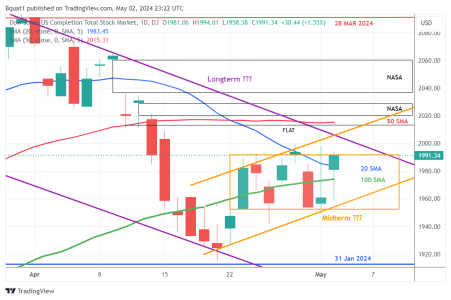
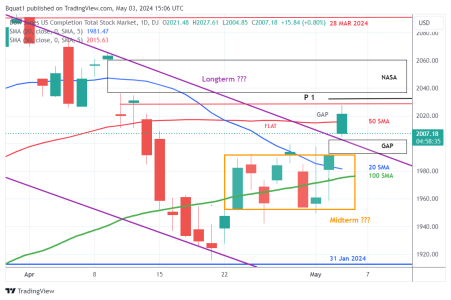
Starting to redraw things for May, with maybe a weaker economy. Well with the new Lonterm, maybe a less chance of gap fill. Leaving Midterm the same for now. Thinking the correction is already in, I am not thinking go away for May and keeping a slightly Bullish outlook because of the election. Pre-May Chart: 
Attachments
Bquat
TSP Talk Royalty
- Reaction score
- 716
Similar threads
- Replies
- 2
- Views
- 534
- Replies
- 2
- Views
- 532
- Replies
- 2
- Views
- 825

