-
The Forum works well on MOBILE devices without an app: Just go to: https://forum.tsptalk.com
-
Please read our AutoTracker policy on the IFT deadline and remaining active. Thanks!
-
$ - Premium Service Content (Info) | AutoTracker Monthly Winners | Is Gmail et al, Blocking Our emails?
Find us on: Facebook & X | Posting Copyrighted Material
-
Join the TSP Talk AutoTracker: How to Get Started | Login | Main AutoTracker Page
You are using an out of date browser. It may not display this or other websites correctly.
You should upgrade or use an alternative browser.
You should upgrade or use an alternative browser.
Bquat's Account Talk
- Thread starter Bquat
- Start date
Bquat
TSP Talk Royalty
- Reaction score
- 803
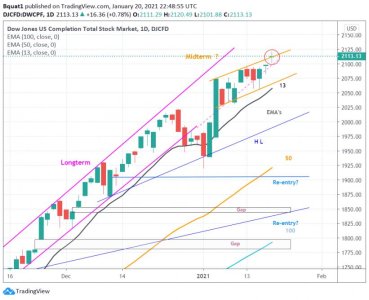
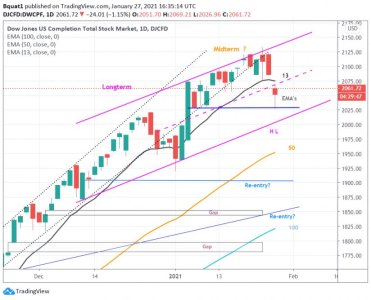
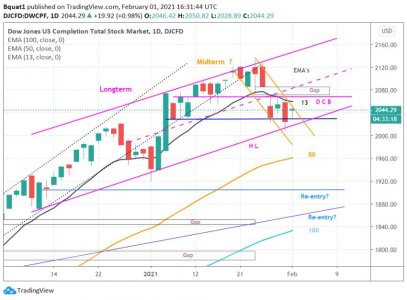
Dropping out of overbought area but not quite a sell signal yet. Testing prior resistance as resistance again from below. Dropped out of F flag (midterm) on FSC.com.:worried:This is 60/40 a false breakout. Topping Doji which is in the middle of the midterm channel on FreeStocksCharts.com and overbought. But i have to show it as a breakout on TradingView.com:
Attachments
Bquat
TSP Talk Royalty
- Reaction score
- 803
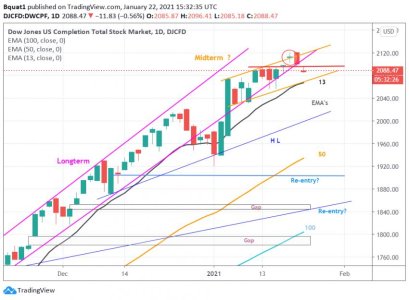
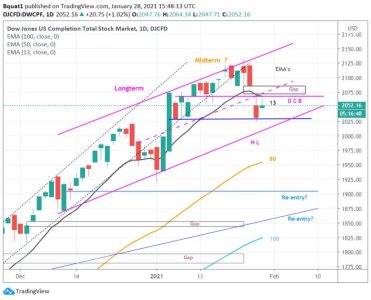
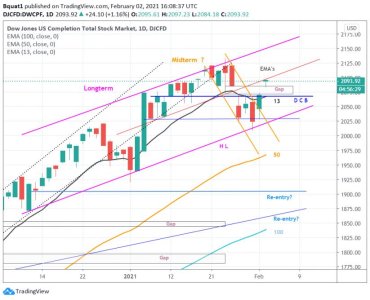
Still within my sell signal.:worried: Fell out of the long term on FreeStockCharts.com. Possible to embed to the downside. So doing a redraw on my Trading View chart to show shorter long term and will have to come up with a new short term:Top of the midterm channel tested as resistance, bottom tested as support. This can become a bearish engulfing candle. Spidey sense::worried: Finally getting a sell signal on stochastics RSI on FSC.com:

Attachments
Bquat
TSP Talk Royalty
- Reaction score
- 803
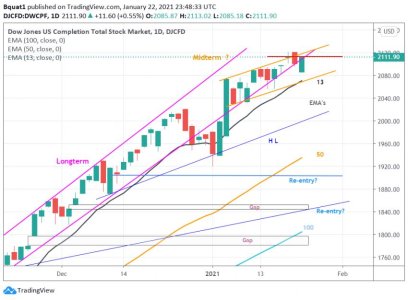
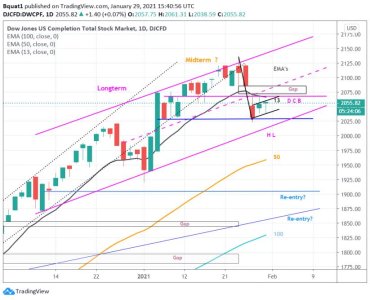
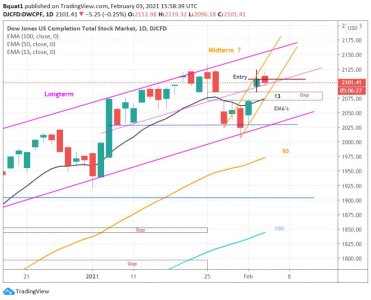
I have us embedded and just my opinion is that this is a dead cat bounce::worried:Still within my sell signal.:worried: Fell out of the long term on FreeStockCharts.com. Possible to embed to the downside. So doing a redraw on my Trading View chart to show shorter long term and will have to come up with a new short term:
Attachments
weatherweenie
TSP Legend
- Reaction score
- 217
I have us embedded and just my opinion is that this is a dead cat bounce::worried:
Great call!
rangerray
TSP Pro
- Reaction score
- 209
Great call!
I agree as well, but I'd still like to see some buying in that last hour before the close, regardless if there's a loss for the day.
Bquat
TSP Talk Royalty
- Reaction score
- 803
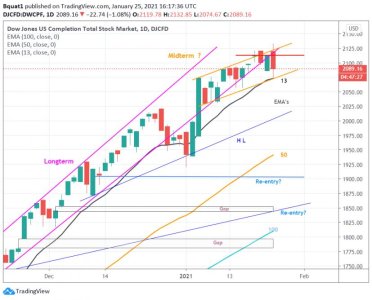
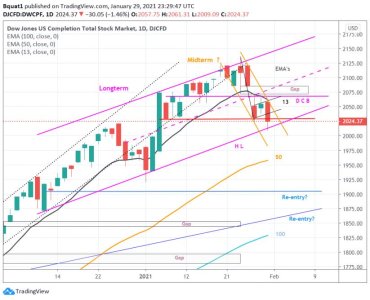
The coin is in the air but since we are embedded I am 60/40 down. The long term channel bottom was confirmed but we failed to get back up above the red line after the bear flag was also confirmed.:worried: Is this a new down channel forming for February:
Attachments
Bquat
TSP Talk Royalty
- Reaction score
- 803
Bquat
TSP Talk Royalty
- Reaction score
- 803
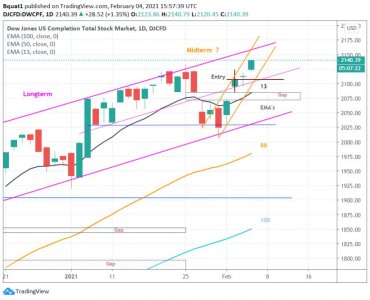
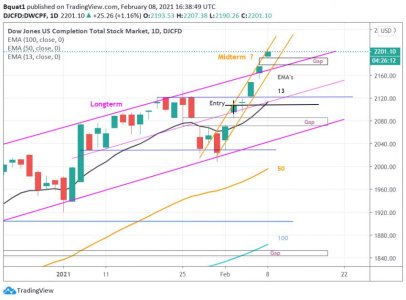
Breakout above long term is confirmed. I have us overbought.:worried: With the stimulus being pushed through I am not issuing a sell. The Midterm channel looks so strong it's 60/40 that we can embed. Last time we stayed three weeks bouncing between 60 and 82 on Stochastics RSI. So I am in the watch mode:
Attachments
flalaw97
TSP Strategist
- Reaction score
- 13
DOes "overbought" lose some meaning when we are talking about a collection of stocks, not a single stock? I was under the impression overbought was connected to the P/E ratio for the stock (Can you do an aggregate P/E for S&P 500 for example?). Thinking out loud here but I guess if the majority of stocks in an index fund are overbought, the ones that aren't may not buoy the index enough to keep it growing. We certainly chart the S&P 500 or DWCPF the same way we do a single stock but something makes me feel like using the same terms like overbought and oversold imply a cap that cannot be supported by the index. Just musing. Thanks again for the great chartwork Bquat! Good luck to all riding the wave up.
Similar threads
- Replies
- 2
- Views
- 690