Bonds

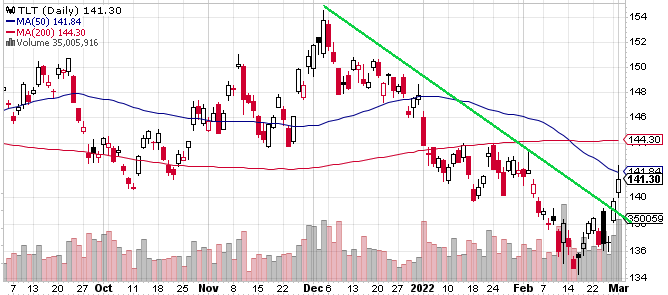
The 30 year has an ugly bear flag on it, but then I noticed several over the years that, after a brief breakdown in a couple, went right back up. 2017 - 2018 was the one actual breakdown, but it survived the long term uptrend.

011822d.gif
 
The 30 year has an ugly bear flag on it, but then I noticed several over the years that, after a brief breakdown in a couple, went right back up. 2017 - 2018 was the one actual breakdown, but it survived the long term uptrend.

011822d.gif

Tom (or Forumites),

Is there a 'volume' stat to these bond fund charts? And, if the volume is dumping what does that likely mean.

I have never really looked at bonds before. They were just a safe haven that had some return. With inflation I think it could turn over with equities.
 
Tough few weeks for bond holders, but an allocation to bonds still lessened the volatility. Why buy US bonds? There's no other good options.

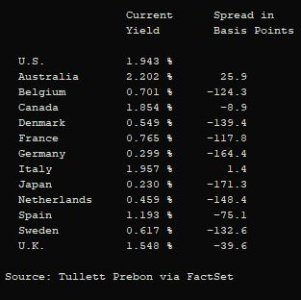
10Y benchmark. US vs other nations.

bonds44435.JPG
 
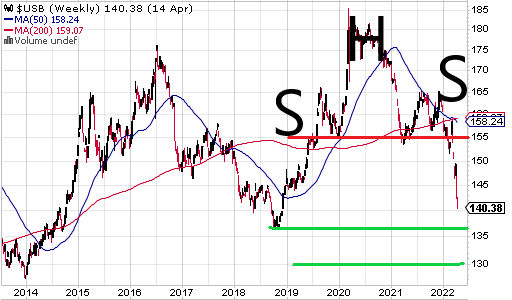
H&S pattern continues to play out with some additional downside to come. This implies slightly higher 30 year yields.

It's easy to sit here today and say yields are going over 5% and that inflation is here to stay, but it was also very easy to say the world was going to end two years ago and people would never need to drive again.

BND3345.png
 
$USB bouncing on that 135 level and a bottom call from JPM yesterday.

The worst of the selloff bulldozing the world’s biggest bond market is likely over for now, according to JPMorgan Asset Management.

That’s the view of Seamus Mac Gorain, head of global rates at the $2.5 trillion investment giant, who said markets have now largely priced in expectations for aggressive US interest rate hikes to combat the highest inflation in four decades. Even if yields inch higher from here, the bulk of painful losses has already been inked, he said.

Treasuries can still “get somewhat higher yields, maybe you get to as high as 3.25%,” London-based Mac Gorain said of the 10-year benchmark, which traded around 2.9% Thursday. “But I think the truth is that a lot of the near term move has already happened at this point. We’ve already had a pretty big correction.

https://www.bloomberg.com/news/arti...ries-rout-is-over-for-now-jpmorgan-asset-says
 
This is actually good news for once...

Bonds are usually priced to math, not panic. Also, there is much more money in bonds than equities so day-to-day change is muted. Right now, we see the normal inflow to bonds when there is an outflow from equities. Bonds were declining simultaneously with equities as a result of the FED needing to bump interest rates. Anyway, if bonds continue to behave normally (ie. they are already priced for the FED rate increases and are now just bubbling along) than we have another safe haven and don't have to park lots of assets in G. G right now is providing a 3% return which is not atrocious, but still...
 
$USB down to 2011 levels. 12% lower from JPM's bottom call a few months ago.

$AGG (F Fund) down to 2016 levels.

Unreal.
 
Not many on Wall Street have witnessed stocks and bonds getting hit at the same time like this.
 
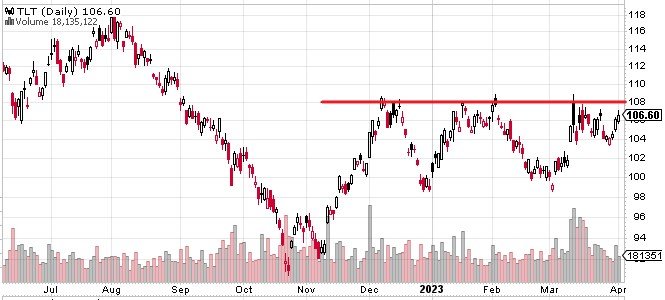
Can the 108 line hold for a fifth time? Many are thinking this war on inflation will go on pause as rate cuts begin again later in the year.

bondtlt.jpg
 
From BofA.

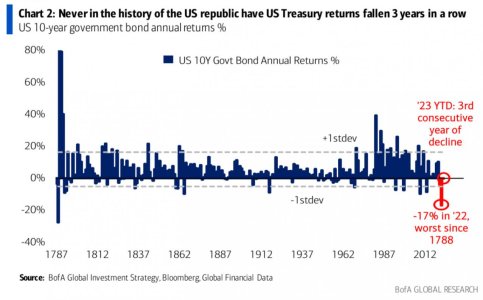
US 10-year bonds down 17% in 2022, the worst year since 1788.

2023 YTD is the third consecutive year of decline for the 10-year (-0.3% in ‘23, -17.0% in ’22, -3.9% in ’21). This has never happened before in the entire 250 years of the US republic.

b4d195e6-a65c-46a8-a9a8-1b90b817c265_1347x838.jpg
 
It was those years of 0% interest rates after 2008 that changed everything.
 
I lost $10,000 in one month in 2008!pig-in-mud.gif
 
Last edited:
Back
Top