The week was Bullish, Controlled, Confident, but not Euphoric or Speculative.
Wk-20 gave us a 5.27% gain with the appearance of a Bullish Marubozu price structure (close near the high, w/open near the low). What we didn't see was excessive volume pressure, it was good, but nothing out of range. While volume was muted, our 1-week average true range was not, with a range of 5.28%.
What made this week unique?
We had +5% gain that wasn't a "recovery week" from a previous larger than average loss.
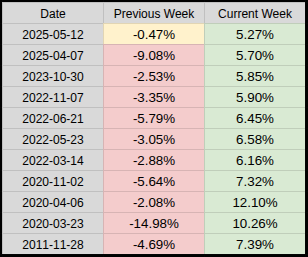
The table below shows us the previous 10 instances where a +5% gain followed a bearish week, while last week our loss was a scant -.47%.
As the table shows, it's typical for a +5% gain to have followed a larger than average loss. From 3.3K weekly closes, the average-of-losses is -1.67% these previous 10 bearish weeks at a minimum are twice that number.
Monday marks the 63rd daily session off the 19-Feb Bull Market Peak.
I asked my AI-Engine to describe the bottom, here's the output.
Time-wise, we have a short high/low range, with the bulls in control.
On the 13-week scale:
Similar to last week, the 13-Week up-creep is slow but rising.
I heard there is a holiday coming up, so we may see lower than normal volume, as folks gear up to take a break.
"On Monday, May 26, 2025 both the New York Stock Exchange (NYSE) and Nasdaq will be closed"
Have a great week... Jason
Wk-20 gave us a 5.27% gain with the appearance of a Bullish Marubozu price structure (close near the high, w/open near the low). What we didn't see was excessive volume pressure, it was good, but nothing out of range. While volume was muted, our 1-week average true range was not, with a range of 5.28%.
What made this week unique?
We had +5% gain that wasn't a "recovery week" from a previous larger than average loss.
The table below shows us the previous 10 instances where a +5% gain followed a bearish week, while last week our loss was a scant -.47%.
As the table shows, it's typical for a +5% gain to have followed a larger than average loss. From 3.3K weekly closes, the average-of-losses is -1.67% these previous 10 bearish weeks at a minimum are twice that number.

Monday marks the 63rd daily session off the 19-Feb Bull Market Peak.
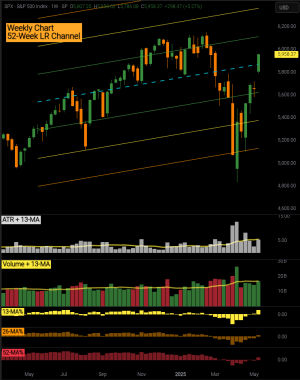
I asked my AI-Engine to describe the bottom, here's the output.
This is not a typical clean V-bottom, where the price just reverses and climbs steadily.
Instead, it's characterized by:- Capitulation low on heavy volatility
- Immediate, powerful bounce
- 1–2 week consolidation (pause/retest)
- Resumption of uptrend with breakout candle on 12-May
Conclusion:
The April 7 low was a volatile, emotional bottom, likely driven by a flush-out move followed by aggressive buying, forming a Volatile V-Bottom with confirmation. The strong Week 20 candle on May 12 acts as the technical validation of this bottom structure.What I'd Expect:
A brief pause or mild dip, then continued upward drift toward the 6000–6050 zone, unless a sharp reversal candle appears with rising volume.

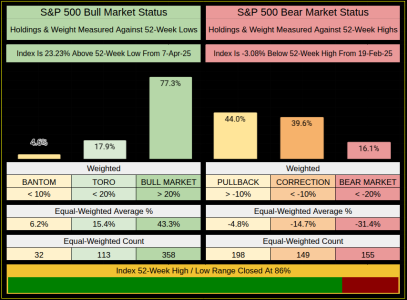
Time-wise, we have a short high/low range, with the bulls in control.
- 52-Week High on 19-Feb-2025
- 52-Week Low on 7-Apr-2025
- We are at 86% of this range

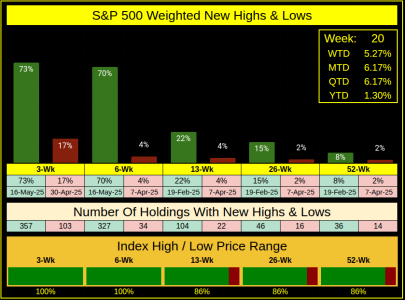
On the 13-week scale:
- Bulls outpaced bears by 104 vs. 22 holdings
- Bulls outpaced bears 22.36% vs. 3.56% by weight
- All of the new 13-Week highs & lows are within the last 6 weeks
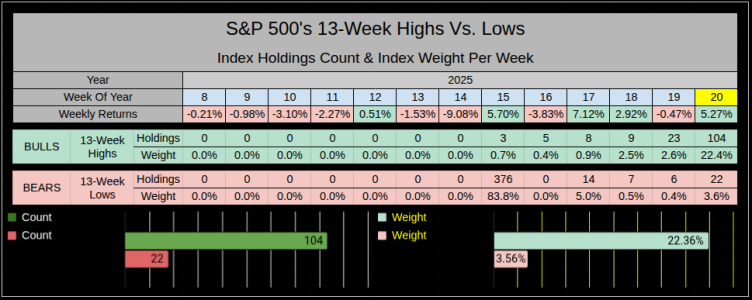
Similar to last week, the 13-Week up-creep is slow but rising.

I heard there is a holiday coming up, so we may see lower than normal volume, as folks gear up to take a break.
"On Monday, May 26, 2025 both the New York Stock Exchange (NYSE) and Nasdaq will be closed"
Have a great week... Jason
Last edited:
