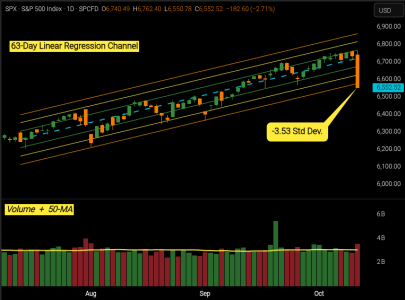
S&P 500, using 10K Sessions as context: Friday's -2.71% loss put the close in the bottom 2% of outcomes, with a top-4% intraday range signaling a volatility spike. Volume was heavy (top 18%) but from my perspective doesn't appear to be a sign of capitulation, more so pointing to an orderly de-risking rather than a full-on panic flush.

On a side note, I wanted to get out the weekend review blog today, but per the usual, I'm revising the AI-Blog-Templates and it's more complicated than it sounds.
Regardless, have a great week.... Jason
An Extreme Single Event on the 63-Session Linear Regression Channel
- A −3.53σ (Standard Deviation) Close is a Bottom 1% event: A rare bird, but not a cluster of black swans.
Definition of Single Events vs. Clustered
- Trigger: Close ≤ −3.0σ.
Clustering rule: All ≤ −3.0σ days that occur within ±5 sessions of each other belong to the same cluster (transitively linked; window is inclusive).
Single Cluster: a cluster of size = 1 (one ≤ −3.0σ day, no others within ±5).
Multi-Day Cluster: a cluster of size ≥ 2 (at least one other ≤ −3.0σ day within ±5).
Frequency across ~10k session closes: How often do we see these?
- Counts (≤ −3.0σ, ±5)
- Total events: 165
- Total clusters: 76
- Single Clusters: 34 (→ 34 events, 20.6% of events)
- Multi-Day Clusters: 42 (→ 131 events, 79.4% of events)
Single Snapbacks vs. Clustered Spillovers (≤ −3.0σ trigger, ±5 sessions)
Singles: Have a high bounce tendency
- Median next-day ΔCls: +0.85σ
- Median 5-day ΔCls: +2.03σ
- Reversion odds (Cls > −2σ within 5): ~85%
- Spillover escalation (another ≤ −4.0σ within 5): ~0% (implied by definition)
- Time to “out of danger” (Cls > −2σ): median 3 sessions
Clustered: Shows bounces are common, but with tail-risk (meaning we go down further)
- Median next-day ΔCls: +0.19σ
- Median 5-day ΔCls: +1.55σ
- Reversion odds (Cls > −2σ within 5): ~60%
- Spillover escalation (≤ −4.0σ within 5): ~26%
- Time to “out of danger” (Cls > −2σ): median 5 sessions
Interpretation
- Treat a Single as a mean-reversion setup with fast normalization and low follow-through towards downside risk.
- Treat a Clustered drawdown as ongoing stress: rebounds occur, but fat-tail risk (deeper shocks) is materially higher and normalization takes longer.
- The 5-Session performance after a ≤ −3.0σ session close
- Average 1.03%
- Min -19,43%
- Max 14.15%
- Total Sum 169.20%

Historical Review
April 2025 “Tariff Correction”
- 08-Apr-20215 was a 3-Consecutive Cluster with a -13.61% 11-session loss, followed by 10.07% 11-Session gain
- Classified as a Cluster at ≤ −3.0σ: 04–08-Apr-2025 with three hits (−3.53σ, −3.06σ, −3.01σ).
- Narrative matches: one hard shock with two fast follow-through probes before stabilizing.
- -6.11% 11-session loss, this was about a 3rd into the -20.06% drawdown.
- There were many brief recoveries followed by one larger draw-down, ultimately we needed 100 sessions to fully recover.
On a side note, I wanted to get out the weekend review blog today, but per the usual, I'm revising the AI-Blog-Templates and it's more complicated than it sounds.
Regardless, have a great week.... Jason
Last edited:
