Stocks finished the trading day near their session lows as Fed Chairman Bernanke's late day speech left the market wondering exactly what the Fed plans on doing post-QE2. The DOW ended the day down 0.2% while the S&P dropped a more modest 0.1%, and the Nasdaq finished just south of flat.
And while stocks put in a big reversal during BB's speech, treasuries finished the day at their best levels.
The dollar took a hit in late afternoon trade, again while BB was delivering his speech, and closed at its worst level of the session. Of course the I fund benefited from the action.
Tomorrow will see the release of the highly volatile MBA Mortgage Index at 7 a.m. ET, and the Fed's Beige Book at 2 p.m. ET.
So it wasn't an ugly day for stocks, but giving up moderate gains in late day trading certainly isn't encouraging. I would think sentiment would take another hit (get more bearish) as result.
And what of the Seven Sentinels? Let's take a look:

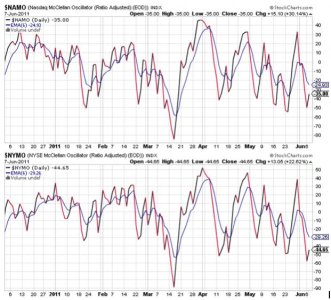
NAMO and NYMO made a modest move higher today, but remain on sells.

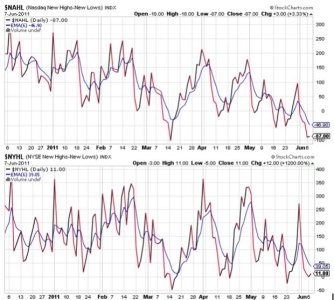
NAHL and NYHL ticked a bit higher today, but remain in a sell condition.

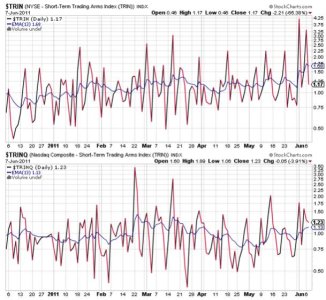
TRIN dropped back down to a buy condition, while TRINQ remained on a sell. What grabs my attention here, is that TRIN's 6 day EMA is higher than it's been since last August (not shown on this chart). What that means is a rising TRIN signals that the Bears are beginning to take control (TRINQ to a lesser extent). When this signal spikes hard above zero (like yesterday) I take a short term contrarian view and expect a reversal. We saw a reversal today, although it didn't hold. But it means this market is under attack. Whether the bulls can wrench it back is another matter.

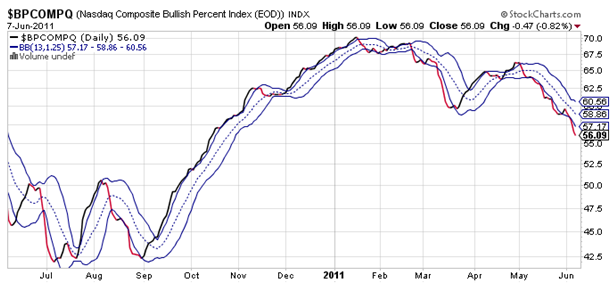
This evening I'm posting a one year chart of BPCOMPQ (usually it's only 6 months). This signal is basically the anchor of the Seven Sentinels. It's direction is proportional to the direction of the market. When it's trending up, so is the market. The same holds true when it is trending down. This makes reversals in the BPCOMPQ an important marker, as they indicate the market is reversing its trend. And right now it's apparent that the intermediate term trend has reversed (the system has been in a sell condition since 23 May). And this signal remains in a sell condition and continues to point lower today.
BPCOMPQ has now dropped below the lows seen this past March, but I don't think I can look at support and resistance with this signal the same as we do with charts of the broader averages. I can only say that the trend is now down.
So while the trend is clearly down, we have seen this market come back over and over again, often in volatile fashion with practically no warning. The main reason it is dropping now, is due to the uncertainty of Fed policy after QE2 expires. Regardless of the relatively dismal economic reports we've seen, Fed policy is what matters most to this market. And today, Fed chairman Ben Bernanke did not clarify what would happen, only that he supports further accommodative monetary policies. That may not be as specific as some would like, but I highly suspect it will be enough at some point to help this market find its footing again.
Given these charts are clearly bearish, there is reason to believe a bottom will be put in soon. Sentiment is getting more bearish, which is a plus. And the Fed, while not entirely direct, has stated they will continue accommodative monetary policy. So chose your time frame. We may turn this week. We may turn next week. But regardless of when it actually happens, we will turn. From what level, I can't be sure, but the charts and sentiment are suggesting a turn in coming. Yes, there's uncertainty. Yes, there's risk. For those who are more risk averse, cash is the place to be. And for those who are risk takers, this may be an opportunity to start accumulating.
There is no holy grail of trading systems. No one ever gets it right every time. No one. The best one can hope for is relative consistency. It's a marathon after all. Not a sprint. Good luck to all.
And while stocks put in a big reversal during BB's speech, treasuries finished the day at their best levels.
The dollar took a hit in late afternoon trade, again while BB was delivering his speech, and closed at its worst level of the session. Of course the I fund benefited from the action.
Tomorrow will see the release of the highly volatile MBA Mortgage Index at 7 a.m. ET, and the Fed's Beige Book at 2 p.m. ET.
So it wasn't an ugly day for stocks, but giving up moderate gains in late day trading certainly isn't encouraging. I would think sentiment would take another hit (get more bearish) as result.
And what of the Seven Sentinels? Let's take a look:

NAMO and NYMO made a modest move higher today, but remain on sells.

NAHL and NYHL ticked a bit higher today, but remain in a sell condition.

TRIN dropped back down to a buy condition, while TRINQ remained on a sell. What grabs my attention here, is that TRIN's 6 day EMA is higher than it's been since last August (not shown on this chart). What that means is a rising TRIN signals that the Bears are beginning to take control (TRINQ to a lesser extent). When this signal spikes hard above zero (like yesterday) I take a short term contrarian view and expect a reversal. We saw a reversal today, although it didn't hold. But it means this market is under attack. Whether the bulls can wrench it back is another matter.

This evening I'm posting a one year chart of BPCOMPQ (usually it's only 6 months). This signal is basically the anchor of the Seven Sentinels. It's direction is proportional to the direction of the market. When it's trending up, so is the market. The same holds true when it is trending down. This makes reversals in the BPCOMPQ an important marker, as they indicate the market is reversing its trend. And right now it's apparent that the intermediate term trend has reversed (the system has been in a sell condition since 23 May). And this signal remains in a sell condition and continues to point lower today.
BPCOMPQ has now dropped below the lows seen this past March, but I don't think I can look at support and resistance with this signal the same as we do with charts of the broader averages. I can only say that the trend is now down.
So while the trend is clearly down, we have seen this market come back over and over again, often in volatile fashion with practically no warning. The main reason it is dropping now, is due to the uncertainty of Fed policy after QE2 expires. Regardless of the relatively dismal economic reports we've seen, Fed policy is what matters most to this market. And today, Fed chairman Ben Bernanke did not clarify what would happen, only that he supports further accommodative monetary policies. That may not be as specific as some would like, but I highly suspect it will be enough at some point to help this market find its footing again.
Given these charts are clearly bearish, there is reason to believe a bottom will be put in soon. Sentiment is getting more bearish, which is a plus. And the Fed, while not entirely direct, has stated they will continue accommodative monetary policy. So chose your time frame. We may turn this week. We may turn next week. But regardless of when it actually happens, we will turn. From what level, I can't be sure, but the charts and sentiment are suggesting a turn in coming. Yes, there's uncertainty. Yes, there's risk. For those who are more risk averse, cash is the place to be. And for those who are risk takers, this may be an opportunity to start accumulating.
There is no holy grail of trading systems. No one ever gets it right every time. No one. The best one can hope for is relative consistency. It's a marathon after all. Not a sprint. Good luck to all.
