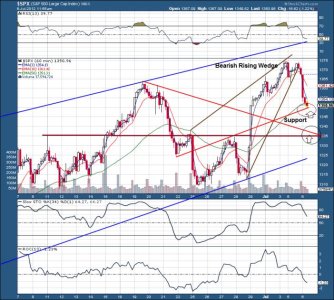
The bearish rising wedge broke on the SP 500 as viewed on the 60 minute chart below. The jobs report was the catalyst, coming in at 80,000 additions vs. 100,000 expected. The market is currently on support at 1350 from a rising diagonal line, with a loss of 17 points this morning. If this support fails, the next stop is in the 1335-1340 area. Below that the rising channel boundary is near 1325. I expect a reversal at one of these supports and a resumption of the uptrend. After all, there was a bunch of European stimulus this week. Of course the "soft patch" could turn into a slippery slope. The market is now oversold on a short term basis. Whether the first support will hold or not is anyone’s guess. I think Europe and the Euro/USD currency cross will provide clues. The Euro/USD is currently carving out a double bottom and is getting oversold; but still may drive lower to near 121; from 122.65 where it is at the moment.


