For informative fun, I thought it'd be interesting to review & compare the first four years of each President, starting with Carter. From Carter to Biden we get 4-years of 8 Presidents comprised of both 4 Democrats & 4 Republicans. I didn't include 2nd Terms, so we can maintain an even playing field of "like" data.
So who's the best Stock Market President?
You decide
First up, we have the 1st Year of the term, it's the stock market's introduction to their new President.
The Bushes are both the best & worst. H. W. Bush gained 27.25%, while W. Bush lost -13.05%
Democrats gained 45.9%
Republicans gained 23.9%

For the 2nd year, Reagan gained 14.76%, while W. Bush lost -23.37%
Democrats lost -6.7%
Republicans lost -21.4%

For the 3rd year, Clinton gained 33.56%, while Obama lost a scant -.003%
Democrats gained 70.1%
Republicans gained 98.8%

For the 4th & final year, Carter gained 25.77%, while Reagan had the smallest gain with 1.40%
Democrats gained 82.8%
Republicans gained 31.1%

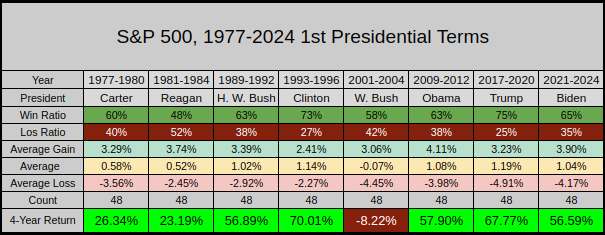
So lets review the 4-year results for each President.
Clinton gained 70.01%, while W. Bush lost -8.22%
Democrats gained 210.8%
Republicans gained 139.6%

This chart measures the Monthly Average True Range for each President.
This is subjective, I would rate Clinton as the most stable, and W. Bush / Obama as the most volatile.

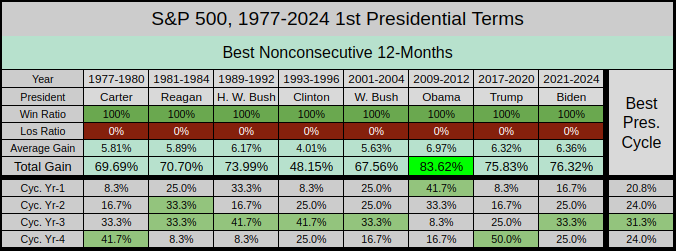
Ok, let's review which President had the 12-Best nonconsecutive months and where those months fell within the 4-Year Presidential Cycle.
Obama gained the most with 83.62%.
For all Presidents, the majority of the 12-Best months fell within the 3rd Year of the Presidential Cycle.
Democrats gained 277.8%
Republicans gained 288.1%

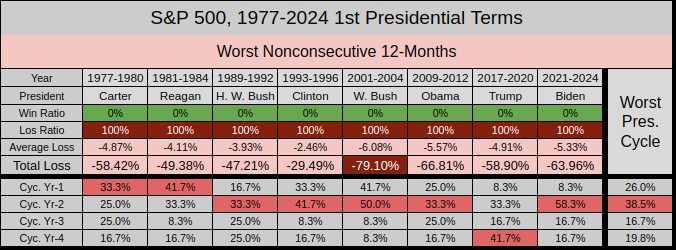
And now we can review which President had the 12-Worst nonconsecutive months and where those months fell within the 4-Year Presidential Cycle.
W. Bush lost the most with -79.10%.
For all Presidents, the majority of the 12-Worst months fell within the 2nd Year of the Presidential Cycle.
Democrats lost -218.7%
Republicans lost -234.6%

While the data was fun to review, truth be told it's likely impossible to statistically decide who the winner is. Setting the President aside, we know congress, world events & wars play a significant factor here. Perhaps the best President is the one who wins the game of musical s...
s...
By equal weight, Clinton has the high score with 48, and W. Bush has the lowest score at 17

Thanks for reading, stay healthy.... Jason
So who's the best Stock Market President?
You decide
First up, we have the 1st Year of the term, it's the stock market's introduction to their new President.
The Bushes are both the best & worst. H. W. Bush gained 27.25%, while W. Bush lost -13.05%
Democrats gained 45.9%
Republicans gained 23.9%

For the 2nd year, Reagan gained 14.76%, while W. Bush lost -23.37%
Democrats lost -6.7%
Republicans lost -21.4%

For the 3rd year, Clinton gained 33.56%, while Obama lost a scant -.003%
Democrats gained 70.1%
Republicans gained 98.8%

For the 4th & final year, Carter gained 25.77%, while Reagan had the smallest gain with 1.40%
Democrats gained 82.8%
Republicans gained 31.1%

So lets review the 4-year results for each President.
Clinton gained 70.01%, while W. Bush lost -8.22%
Democrats gained 210.8%
Republicans gained 139.6%

This chart measures the Monthly Average True Range for each President.
This is subjective, I would rate Clinton as the most stable, and W. Bush / Obama as the most volatile.

Ok, let's review which President had the 12-Best nonconsecutive months and where those months fell within the 4-Year Presidential Cycle.
Obama gained the most with 83.62%.
For all Presidents, the majority of the 12-Best months fell within the 3rd Year of the Presidential Cycle.
Democrats gained 277.8%
Republicans gained 288.1%

And now we can review which President had the 12-Worst nonconsecutive months and where those months fell within the 4-Year Presidential Cycle.
W. Bush lost the most with -79.10%.
For all Presidents, the majority of the 12-Worst months fell within the 2nd Year of the Presidential Cycle.
Democrats lost -218.7%
Republicans lost -234.6%

While the data was fun to review, truth be told it's likely impossible to statistically decide who the winner is. Setting the President aside, we know congress, world events & wars play a significant factor here. Perhaps the best President is the one who wins the game of musical
By equal weight, Clinton has the high score with 48, and W. Bush has the lowest score at 17

Thanks for reading, stay healthy.... Jason
Last edited:
