On the last trading trading day of 2010 the S&P 500 closed at 1257.64. The last trading day of 2011 the S&P 500 closed at 1257.60. So after one year we're back to square one.

Trading was very light and largely mixed, with the major averages floating above and below the neutral line. But selling pressure picked up a bit towards the close, which ultimately led those averages to settle around their lows of the day.
Here's how the charts look going into the new year:
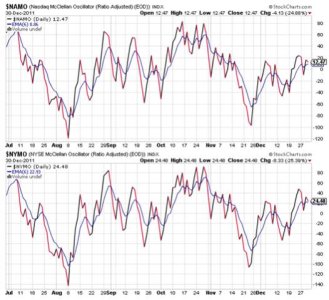
NAMO and NYMO ebbed a bit lower, but remain in positive territory and on buys. They are also very near their trigger points.
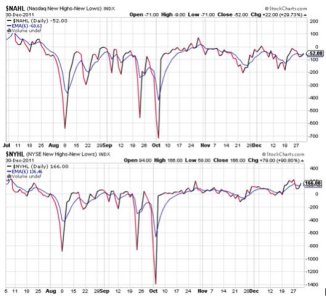
NAHL and NYHL managed to move higher and are also on buys.
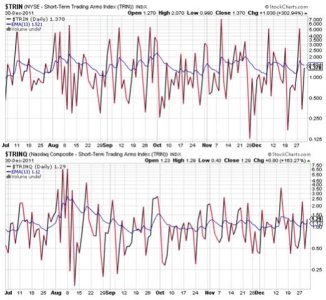
TRIN and TRINQ both worked off their overbought conditions with TRIN remaining on a buy and TRINQ flipping to a sell. They are now neutral overall.
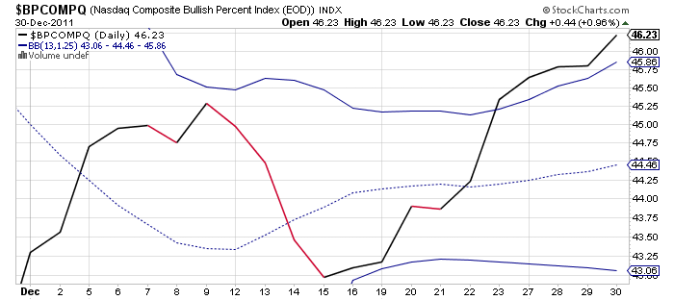
BPCOMPQ managed to move a bit higher today and remains in a buy condition.
So the signals are mixed, but neutral overall. Although BPCOMPQ suggests higher prices may be coming. The Seven Sentinels remain in a buy condition going into the new year.
I can't read much into the signals as they are now largely neutral and the first two trading days of January are part of the Santa Claus rally time frame, which means seasonality is still positive. But traders are returning from holiday break too, so we'll see how it goes.
I'll have the tracker charts posted by Monday. Our sentiment survey backed off its highly bullish stance for the new week, so it will be interesting to see if our stock allocations followed suit. See you then.

Trading was very light and largely mixed, with the major averages floating above and below the neutral line. But selling pressure picked up a bit towards the close, which ultimately led those averages to settle around their lows of the day.
Here's how the charts look going into the new year:

NAMO and NYMO ebbed a bit lower, but remain in positive territory and on buys. They are also very near their trigger points.

NAHL and NYHL managed to move higher and are also on buys.

TRIN and TRINQ both worked off their overbought conditions with TRIN remaining on a buy and TRINQ flipping to a sell. They are now neutral overall.

BPCOMPQ managed to move a bit higher today and remains in a buy condition.
So the signals are mixed, but neutral overall. Although BPCOMPQ suggests higher prices may be coming. The Seven Sentinels remain in a buy condition going into the new year.
I can't read much into the signals as they are now largely neutral and the first two trading days of January are part of the Santa Claus rally time frame, which means seasonality is still positive. But traders are returning from holiday break too, so we'll see how it goes.
I'll have the tracker charts posted by Monday. Our sentiment survey backed off its highly bullish stance for the new week, so it will be interesting to see if our stock allocations followed suit. See you then.
