There hasn't been very many dips this year and the ones we've had did not last long or go very deep. But those dips managed to quickly turn sentiment bearish and roll over many technical indicators to sells, whipsawing many traders. The current weakness this market is experiencing has a decidedly different feel to it. Talk of Fed "tapering" has some speculating that this is contributing to current market jitters as traders worry the Fed may curtail its unprecedented monetary stimulus should recent improvement in domestic economic data prove sustainable. Some are pointing to the recent "flash" crash in Japan's Nikkei average as an early warning sign for troubled economies worldwide. And bonds are in a significant short term tailspin. The yield on the benchmark 10 year note is at highs not seen since April of 2012. It may simply be that yields are bouncing off the lower rates seen earlier this year, but the sell off is happening in many bond sectors. All these events are triggering speculation that the bull market may be nearing an end.
That certainly remains to be seen, and I for one am not in that camp just yet. Yes, Friday's action was bearish. I especially did not like the accelerated selling pressure as the trading day was winding down. It certainly suggests there may be some follow through downside action next week, but longer term? I'm still a bull in that time frame. Let's look at some charts:
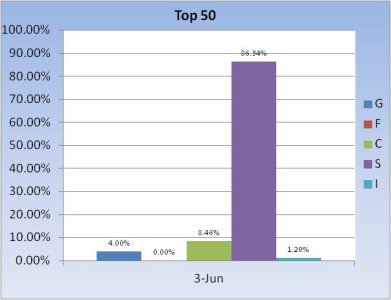
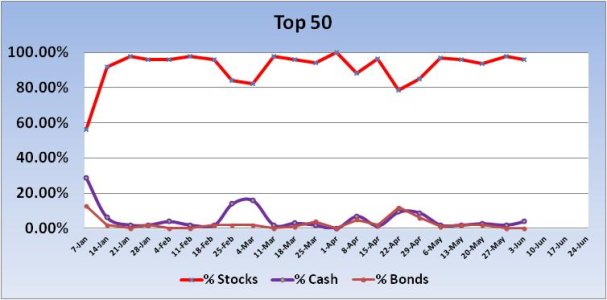
The Top 50 only pulled back their stock exposure modestly going into the new week, dropping exposure by 1.86% for a total stock allocation of 96%.
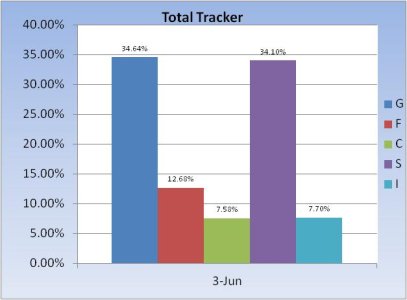
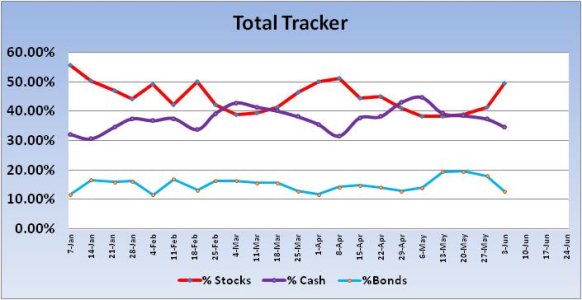
The total tracker shows dip buying this past week as stock allocations rose by 7.92%, from 41.45% to 49.37%. That's not a signal, but it's enough of a move to anticipate more weakness in the short term to shake the newly minted bulls. Note the big drop in bond exposure.
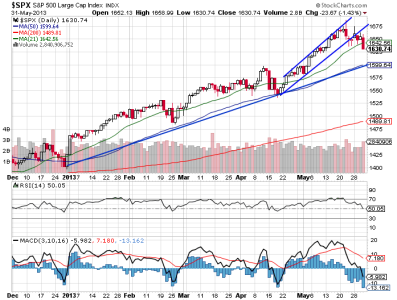
The S&P fell through it's intermediate term trend support line early last week. That would now act as resistance. But price had remained above the 21 dma until Friday's sell off. Longer term, support can be seen around 1600. That's also approximately where the 50 dma is. I'd not be surprised if the market tests that support. RSI is falling and is now at the neutral line, while MACD is negative and pointing lower.
Our sentiment survey came in at 43% bulls to 46% bears. That keeps the system in a buy condition and is another reason why I can't get too bearish here. At least not yet. But remember, I'm looking at the intermediate term and not the short term.
So I'm anticipating more weakness with the S&P possibly testing its lower trend line and 50 dma. And while there may be some dip buying go on, I'd be surprised if sentiment didn't get more bearish in some surveys. The late action on Friday is not reflected in some of those surveys yet. I suspect our survey would have been more bearish had Friday's action happened on Thursday. In any event, Monday promises to be an interesting trading day. Watch the volatility.
That certainly remains to be seen, and I for one am not in that camp just yet. Yes, Friday's action was bearish. I especially did not like the accelerated selling pressure as the trading day was winding down. It certainly suggests there may be some follow through downside action next week, but longer term? I'm still a bull in that time frame. Let's look at some charts:


The Top 50 only pulled back their stock exposure modestly going into the new week, dropping exposure by 1.86% for a total stock allocation of 96%.


The total tracker shows dip buying this past week as stock allocations rose by 7.92%, from 41.45% to 49.37%. That's not a signal, but it's enough of a move to anticipate more weakness in the short term to shake the newly minted bulls. Note the big drop in bond exposure.

The S&P fell through it's intermediate term trend support line early last week. That would now act as resistance. But price had remained above the 21 dma until Friday's sell off. Longer term, support can be seen around 1600. That's also approximately where the 50 dma is. I'd not be surprised if the market tests that support. RSI is falling and is now at the neutral line, while MACD is negative and pointing lower.
Our sentiment survey came in at 43% bulls to 46% bears. That keeps the system in a buy condition and is another reason why I can't get too bearish here. At least not yet. But remember, I'm looking at the intermediate term and not the short term.
So I'm anticipating more weakness with the S&P possibly testing its lower trend line and 50 dma. And while there may be some dip buying go on, I'd be surprised if sentiment didn't get more bearish in some surveys. The late action on Friday is not reflected in some of those surveys yet. I suspect our survey would have been more bearish had Friday's action happened on Thursday. In any event, Monday promises to be an interesting trading day. Watch the volatility.
