The major averages may not have changed much on a weekly basis last week, but Thursday's hard plunge got many trader's attention. Last week the Top 50 had dropped their collective stock exposure by 17% to a total allocation of just 19.8%. This week, even more cash was raised by this group.
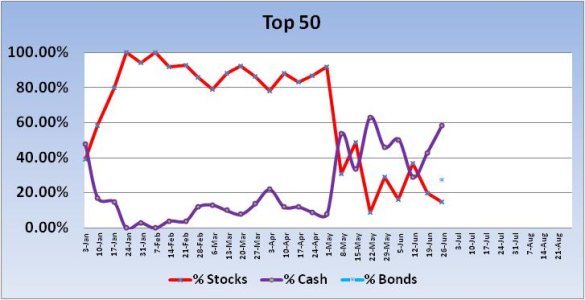
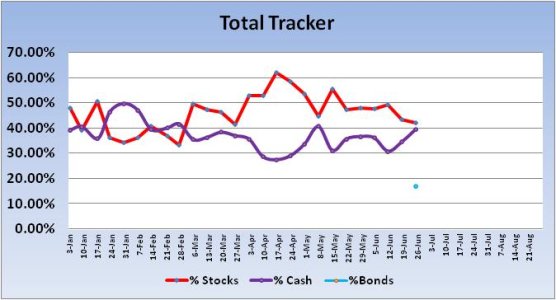
I've made a change to the trend charts below. I am going to start tracking bond exposure (F fund) along with cash (G fund) and stocks (C,S,I funds). I don't have any historical data to plug into the chart, so this week will be the starting point for bond levels.


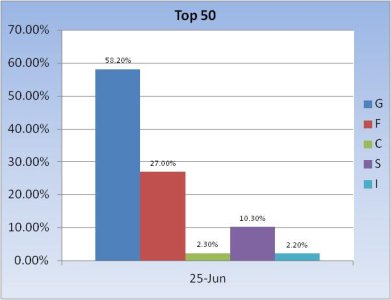
Looking at the charts, you can see stock levels dipped again; this time by 5%. That leaves the Top 50 with a total stock allocation of 14.8%.


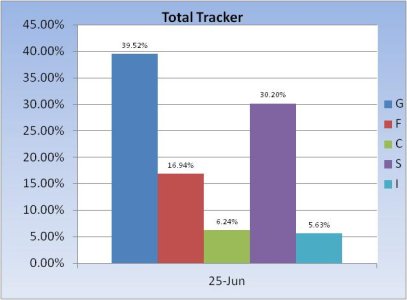
The Total Tracker also shows a dip in stock levels, but only by 1.17%. Total stock allocations for this group now sit at 42.07%.
Obviously, as a group we continue to be very conservative overall. And our sentiment survey continues to reflect that fact as the system remained on a buy for the tenth week in a row.
The Seven Sentinels remain in a buy condition, but not by much. BPCOMPQ kept the system in the market by a slim margin at Thursday's close. And it wouldn't take much to trigger a sell signal at this point. I'm anticipating that we'll see more weakness this week, but volatility (whipsaws) will continue to make things challenging for us.
I've made a change to the trend charts below. I am going to start tracking bond exposure (F fund) along with cash (G fund) and stocks (C,S,I funds). I don't have any historical data to plug into the chart, so this week will be the starting point for bond levels.


Looking at the charts, you can see stock levels dipped again; this time by 5%. That leaves the Top 50 with a total stock allocation of 14.8%.


The Total Tracker also shows a dip in stock levels, but only by 1.17%. Total stock allocations for this group now sit at 42.07%.
Obviously, as a group we continue to be very conservative overall. And our sentiment survey continues to reflect that fact as the system remained on a buy for the tenth week in a row.
The Seven Sentinels remain in a buy condition, but not by much. BPCOMPQ kept the system in the market by a slim margin at Thursday's close. And it wouldn't take much to trigger a sell signal at this point. I'm anticipating that we'll see more weakness this week, but volatility (whipsaws) will continue to make things challenging for us.
