We should be getting used this by now. Moderate reversals, which often have enough follow-through to shake Intermediate Term investors out of their positions. It's easy to say that due to our handcuffed IFT requirements stronger hands are required to get through this kind of volatility, and I intend to have stronger hands, but that doesn't mean I can't get fooled by a more pronounced sell-off than has been typical the past few months. I need other indicators to help me. After Friday's action (which was Options Expiration BTW) it would be wise to take a hard look at where we may be headed in the next few days in an attempt to determine how valid a Seven Sentinels sell signal may be should one be issued soon. That means looking beyond a potential Seven Sentinels signal in an effort to determine whether a sell signal should be followed or not. Since I have already used one IFT, I only have one left. We have exactly two weeks of trading left in the month of October. If a sell signal is issued soon, I'd like to feel comfortable that it will last for more than 2 weeks, otherwise holding my position in the face of declining prices may be in my best interest.
Of course there are many variables to consider, and perhaps the biggest one is how deep any potential pullback may be. At the moment, the market has still not shown us any hard evidence that the underlying strength this market has shown for so long is about to dissipate. And that strength has tended to manifest itself with impressive gains in very short time frames.
First things first, let's look at the latest SS charts:

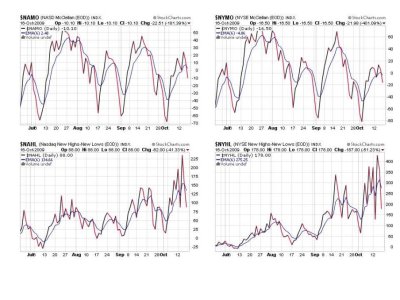
Not unexpectedly, all four of these signals are flashing sells after Friday. Looking at NAMO and NYMO I found that they are currently around their respective average of the past several months. Since we appear to be on a downward cycle, I would not be surprised to see those two signals reach as low as about -70 on each chart. Anything lower than that would imply more serious selling than we've seen since the March low. NYMO may drop just a bit more than NAMO, but not by more than another -10. In each case where these signals have reached this low in the past few months they have quickly reversed. That's 5 times since mid-June. As I had mentioned previously, we are already at the mid-point of the peak to peak range. So that lower level will have to be watched carefully.
NAHL and NYHL have reversed quickly, although the EMA has been moving higher over the past several months. If NAHL gets below 25 and/or NYHL gets below 50 that will be cause for concern. It is not something I expect to see happen at this point, but those levels need to be watched carefully.

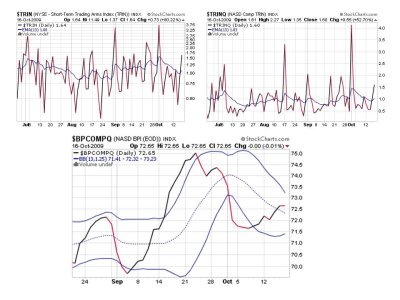
Both TRIN and TRINQ and flashing sells. These are fast moving signals and at this point I am not watching them as closely as the four previous signals. BPCOMPQ however, is important in ascertaining trend. The following link will help you understand what BPCOMPQ is, how it is calculated, and how it used by technicians
http://www.tradingonlinemarkets.com/Articles/Technical_Analysis/BPCOMPQ.htm
At the moment, it is still very much showing a strong trending market. Anything over 70 is considered overbought, but context and perspective may be needed here in light of the pricing carnage we saw previous to the March lows.

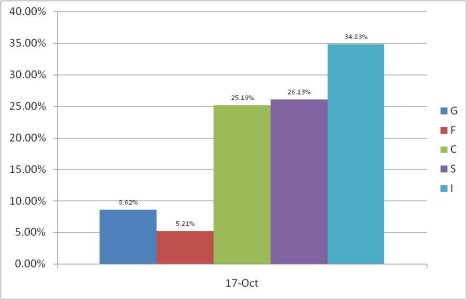
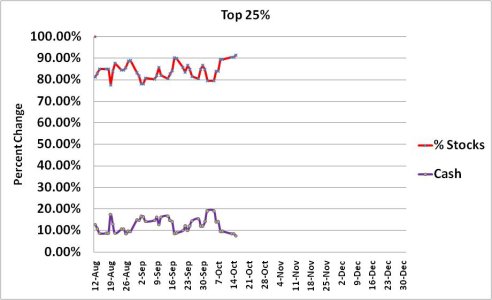
We saw a modest shift Friday, in our Top 25% stock allocation. It appears some took profits and bailed to the F fund.

The trend in this chart remains the same.
Of course there are many variables to consider, and perhaps the biggest one is how deep any potential pullback may be. At the moment, the market has still not shown us any hard evidence that the underlying strength this market has shown for so long is about to dissipate. And that strength has tended to manifest itself with impressive gains in very short time frames.
First things first, let's look at the latest SS charts:

Not unexpectedly, all four of these signals are flashing sells after Friday. Looking at NAMO and NYMO I found that they are currently around their respective average of the past several months. Since we appear to be on a downward cycle, I would not be surprised to see those two signals reach as low as about -70 on each chart. Anything lower than that would imply more serious selling than we've seen since the March low. NYMO may drop just a bit more than NAMO, but not by more than another -10. In each case where these signals have reached this low in the past few months they have quickly reversed. That's 5 times since mid-June. As I had mentioned previously, we are already at the mid-point of the peak to peak range. So that lower level will have to be watched carefully.
NAHL and NYHL have reversed quickly, although the EMA has been moving higher over the past several months. If NAHL gets below 25 and/or NYHL gets below 50 that will be cause for concern. It is not something I expect to see happen at this point, but those levels need to be watched carefully.

Both TRIN and TRINQ and flashing sells. These are fast moving signals and at this point I am not watching them as closely as the four previous signals. BPCOMPQ however, is important in ascertaining trend. The following link will help you understand what BPCOMPQ is, how it is calculated, and how it used by technicians
http://www.tradingonlinemarkets.com/Articles/Technical_Analysis/BPCOMPQ.htm
At the moment, it is still very much showing a strong trending market. Anything over 70 is considered overbought, but context and perspective may be needed here in light of the pricing carnage we saw previous to the March lows.

We saw a modest shift Friday, in our Top 25% stock allocation. It appears some took profits and bailed to the F fund.

The trend in this chart remains the same.
