Last week I pointed out that the Top 50 had dropped their collective stock exposure by 13.6% going into last week's trading. This was notable because any shift that exceeds 10% (up or down) has usually seen the stock market move in the opposite direction on a weekly basis. Last week the S fund was up 2.27%, while the C fund rose 1.21%. That's now 10 times out of 13 (this year) that the Top 50 got it wrong when they dropped stock allocations by more than 10%.
This week, the Top 50 increased their stock exposure by 16.6%. But this is a bullish shift in a bull market and that has not been as predictive this year. It's happened 14 times with the results split right down the middle (7 times right, 7 times wrong). So it's not a reliable indicator. And given seasonality I'd have to give the nod to the bulls for this week, but that's not to say there's no risk in this market right now.
Here's this week's charts:
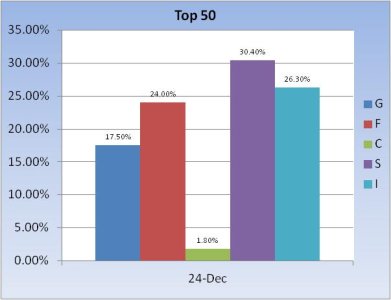
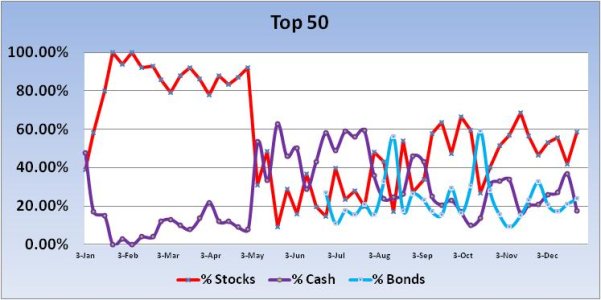
The Top 50 have a total stock allocation of 58.5% to start the new trading week, with an allocation of 24% in bonds and 17.5% in treasuries.
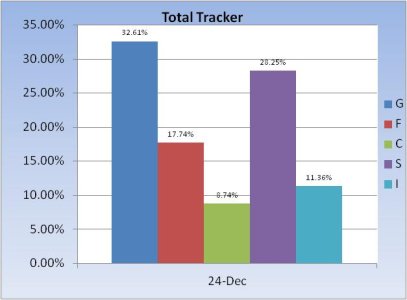
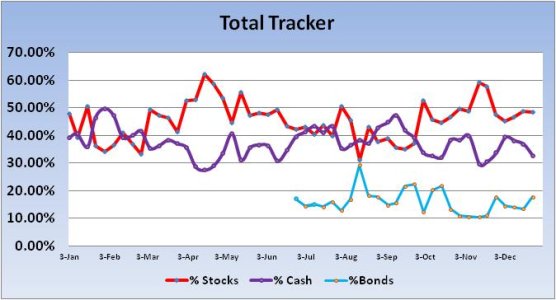
The Total Tracker had almost no change in stock allocations with a modest dip in treasuries and corresponding rise in bond holdings.
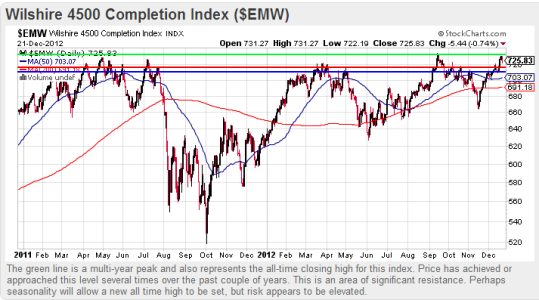
I usually post the S&P 500 chart, but this week I'm showing the Wilshire 4500, which reflects the entire US market minus the S&P 500. Each line (blue, red, green) is a resistance line, but that green line is especially important as it represents the all-time closing high for this index. We've come just short of that mark during the latest rally, with prices faltering late last week. I cannot post any more charts as I'm limited to five in any blog, but TRIN and TRINQ closed at relatively high readings on Friday and that may be an early indication of continued weakness. But seasonality may keep this market afloat for awhile yet. We shall see, but I do note that futures are moderately lower as I write this blog.
This week, the Top 50 increased their stock exposure by 16.6%. But this is a bullish shift in a bull market and that has not been as predictive this year. It's happened 14 times with the results split right down the middle (7 times right, 7 times wrong). So it's not a reliable indicator. And given seasonality I'd have to give the nod to the bulls for this week, but that's not to say there's no risk in this market right now.
Here's this week's charts:


The Top 50 have a total stock allocation of 58.5% to start the new trading week, with an allocation of 24% in bonds and 17.5% in treasuries.


The Total Tracker had almost no change in stock allocations with a modest dip in treasuries and corresponding rise in bond holdings.

I usually post the S&P 500 chart, but this week I'm showing the Wilshire 4500, which reflects the entire US market minus the S&P 500. Each line (blue, red, green) is a resistance line, but that green line is especially important as it represents the all-time closing high for this index. We've come just short of that mark during the latest rally, with prices faltering late last week. I cannot post any more charts as I'm limited to five in any blog, but TRIN and TRINQ closed at relatively high readings on Friday and that may be an early indication of continued weakness. But seasonality may keep this market afloat for awhile yet. We shall see, but I do note that futures are moderately lower as I write this blog.
