A2Z1112 Account Talk

Re: A2z1112 Account Talk

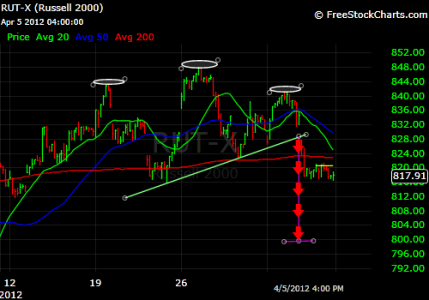
Last week we saw where the European indicies put in a bearsish H/S patterns which were all breaking to the downside. Today's futures look like were in for a rough ride. RUT 2000 has also put in a bearish H/S pattern!!! Buckle up!!!

RUT2000.png
 
Re: A2z1112 Account Talk

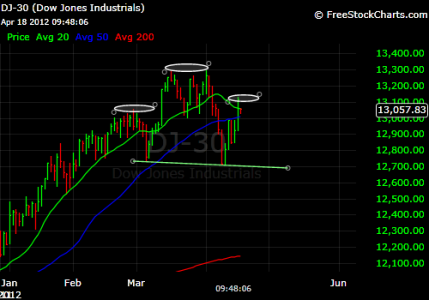
DJIA.png

Is the DJIA putting in a H/S pattern? Looks like the market is forming the right shoulder. If this were to come to fruition then it could resolve itself down around the 200 DMA. Remember some of the European indices (FTSE and CAC40) put in similar patterns app 2 weeks ago!!! They both fullfilled the H/S patterns with the FTSE touching the 200DMA and the CAC40 breaking the 200 dma.
 
Re: A2z1112 Account Talk

SP500.png

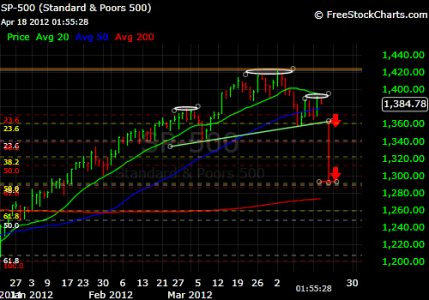
Above chart of the SP-500 also shows a potential H/S pattern forming which if it plays out would put price in the 1290 area, close to the 200 DMA. I have also drawn in fibonacci retracements from the 10/4, 11/25, and 12/19/2011 lows to create a confluence support grid to locate potential support levels should the H/S pattern play out. The first confluence/support level (2 retracements) is at the 1340 level which corresponds to the 3/6/12 low. The next confluence/support level (3 retracements) is at the 1290ish level which also corresponds to the target level should the current H/S pattern play out!!! The 1292 level corresponds with the 10/27/2011 high. Interesting enough as UPTREND has pointed out the Elliott Wave pattern target level is 1286-1315. I'm not trying to be bearish just looking at what the charts are indicating and trying to setup accordingly. I also find it very interesting how some of the European markets have put in similar H/S patterns app 2 weeks ago and have fulfilled their respective downward target levels around the 200 DMA. Continuing to build my position in TZA and sitting in the G fund waiting for a good buying oppurtunity. Any and all suggestions, criticism and comments are welcome.:)
 
Re: A2z1112 Account Talk

I would like to buy more TZA as well, but with how the market has been I am scared to. Hmmm...I'll see how the last hour looks I suppose.
 
Re: A2z1112 Account Talk

I would like to buy more TZA as well, but with how the market has been I am scared to. Hmmm...I'll see how the last hour looks I suppose.
This topping in the markets is tough to read and time. Need patience and buy in small amounts, DCA!
 
Re: A2z1112 Account Talk

View attachment 18591

Above chart of the SP-500 also shows a potential H/S pattern forming which if it plays out would put price in the 1290 area, close to the 200 DMA. I have also drawn in fibonacci retracements from the 10/4, 11/25, and 12/19/2011 lows to create a confluence support grid to locate potential support levels should the H/S pattern play out. The first confluence/support level (2 retracements) is at the 1340 level which corresponds to the 3/6/12 low. The next confluence/support level (3 retracements) is at the 1290ish level which also corresponds to the target level should the current H/S pattern play out!!! The 1292 level corresponds with the 10/27/2011 high. Interesting enough as UPTREND has pointed out the Elliott Wave pattern target level is 1286-1315. I'm not trying to be bearish just looking at what the charts are indicating and trying to setup accordingly. I also find it very interesting how some of the European markets have put in similar H/S patterns app 2 weeks ago and have fulfilled their respective downward target levels around the 200 DMA. Continuing to build my position in TZA and sitting in the G fund waiting for a good buying oppurtunity. Any and all suggestions, criticism and comments are welcome.:)[/QUOTE


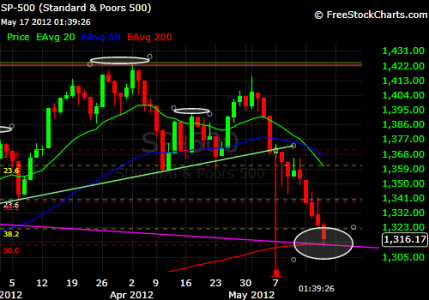
SP-500514.png

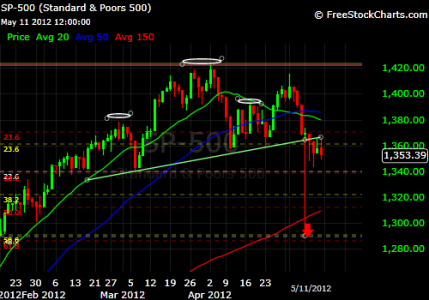
I have updated a chart which I originally posted on 4/18/12. The SP is at a critical juncture. The large H/S pattern has broken down through the neckline and based on today futures looks like we are going to test the 1340 area and make lower lows. This is the first confluence/support level and if it doesn't hold there is very little support until the 1290 level. Needless to say but our markets are once again being driven by the European markets. The Euro is also breaking down.
 
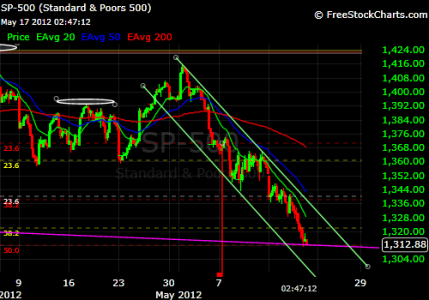
SP517.png

Looks like the SP is at a critical level at 1312. The purple line is a trend line drawn from the 10/12/07 and 5/6/2011 highs. The 200 day EMA is also at 1312 and the Fibonacci retracement from the 12/19/11 low is at the 50.0 at 1312ish. Intraday the SP price made a low of 1311.01 and then the Bulls quickly recovered this level and then some. SP is currently dropping to retest this 1312 area. I believe if this area is broken then the SP price will go to the 1290ish level where there is support and the fibonacci 61.8 retracement level. The European markets continue to make new lows. The CAC, FTSE and the DAX have broken through their respective 200 day EMA and the 50 day EMA has crossed the 200 day (CAC) or is very close to crossing (DAX and FTSE). They all have completed HS patterns, dropped to their estimated levels and continue to break down in price. In the US markets the DJT, RUT and the W4500 are all trading below their respective 200 day EMA. The NDX, COMPQ and the DJIA have broken the 50 day EMA and are rapidly closing in on the 200 day. On all US markets the 20 and 50 day EMA have taken a hard turn south. It seems the next few trading sessions will be critical. With all the bad news coming out of Europe one has to be concerned if these levels will hold. The new French president was quoted as saying he wanted to see the EURO at 1.22ish. When he was sworn in a few days ago the EURO was at 1.32ish and is currently at 1.2714 and going lower. A lower EURO lends to a higher dollar which is usually bad for the US markets. Greece next vote is scheduled for 6/17...along time for this market to twist with the Greek issue AGAIN. Spain and Italy borrowing costs continue to escalate approaching that critical 7% level which is unsustainable and could require bailouts. ETC, ETC... The markets indicators are showing we are in oversold territory. I believe the indicies can stay in the oversold area for sometime while the indicators reflect a oversold market and the price still continue to make new lows!!! Thus far the CAC40 is down app 15% and the FTSE100 is down app 11% from their respective mid-March highs!!! The European market HS patterns/declines were app 2 weeks prior to the ones in the US markets. Anyone have any good news or thoughts besides hopium.:(
 
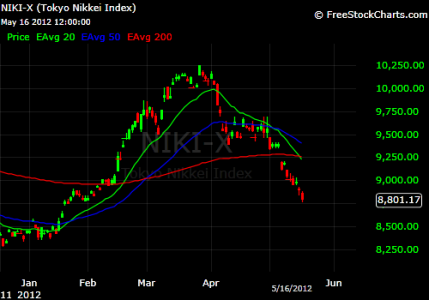
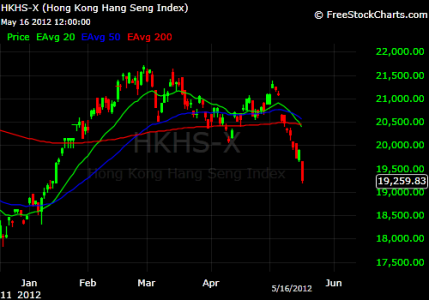
NIKKEI.pngHSI517.png

Looking at the rest of the world...The Tokoyo NIKKEI Index and the Hong Kong Hang Seng Index. The NIKKEI is down app 14% and the Hang Seng is down app 11% from their recent respective highs. This is one ugly market!!!
 
Back
Top