-
The Forum works well on MOBILE devices without an app: Just go to: https://forum.tsptalk.com
-
Please read our AutoTracker policy on the IFT deadline and remaining active. Thanks!
-
$ - Premium Service Content (Info) | AutoTracker Monthly Winners | Is Gmail et al, Blocking Our emails?
Find us on: Facebook & X | Posting Copyrighted Material
-
Join the TSP Talk AutoTracker: How to Get Started | Login | Main AutoTracker Page
You are using an out of date browser. It may not display this or other websites correctly.
You should upgrade or use an alternative browser.
You should upgrade or use an alternative browser.
A2Z1112 Account Talk
- Thread starter A2Z1112
- Start date
- Reaction score
- 3,010
Just go to Members' Account Talk and use the sort feature to sort by title and find A2Z1112 Account Talk.
- Reaction score
- 960
Thanks!! Sorry about that!! Since I don't post often...where would I find this thread in the future???
Right here in the "Members Account Talk" thread. Right where you originally posted it. What happens is, if you do not post often it might fall into the lower pages.
- Reaction score
- 960
Thanks!!! For retirement information I received my AL check last week (Uncle Sugar and Georgia took a decent junk in taxes) but still have not received my interim annuity!!!
What was the percentage taken out in taxes? Just wondering because I'm retiring June 1st.
- Reaction score
- 3,010
...or just put 'A2Z1112' in the search box. It should bring up this thread.Just go to Members' Account Talk and use the sort feature to sort by title and find A2Z1112 Account Talk.
By the way, I just merged in a 3rd A2Z1112 account talk that I found.
")
- Reaction score
- 960
Federal took 25%, Georgia took 6%, plus deductions for SS and Medicare. All told they took app 36%!!!
Thanks
Re: A2z1112 Account Talk
To update my retirement finances from OPM: Retired 12/31/2011.
Received Al check 2/6/12
Received 1st interim pymt 2/17/12 (Withheld app 20% Fed tax)
Received 2nd interim pymt 3/1/12 (Withheld app 15% Fed tax)
Looks like I am receiving app 95% of my agencies retirement estimate. Needless to say I am very happy compared to some of the horror stories I have heard from other folks!!! Hopefully they will have me adjudicated in app 4 months time!!!
Kaufmanrider
TSP Analyst
- Reaction score
- 17
Re: A2z1112 Account Talk
That's fantastic.
Looks like I am receiving app 95% of my agencies retirement estimate. Needless to say I am very happy compared to some of the horror stories I have heard from other folks!!! Hopefully they will have me adjudicated in app 4 months time!!!
That's fantastic.
Re: A2z1112 Account Talk

SP-500 has broken bearish rising wedge and the 20DMA on the daily chart. Currently testing the trend line from the Nov and Dec lows!!!
Russell 2000 has broken down from a consolidation period, broken through the 20 DMA and is testing the 50 DMA!!!

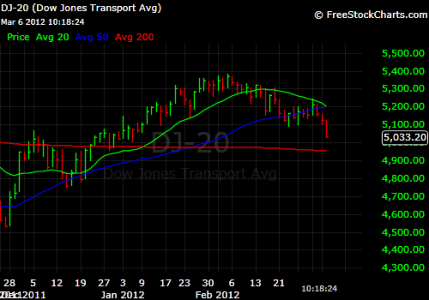
DJTRANS has broken the 20 and 50DMA!!!
Additionally the DJIA, NASDAQ COMPQ, NDX100, W4500 and the DAX have all broken 20 DMA!!! Will we follow the leaders? Food for thought...Apple is having an announcement day tomorrow for the IPAD 3. As in the past...prior to announcement APPLE stock rises and a day or so prior and/or afterwards usually sells off. Being Apple is such a large position on the Nasdaq will this sell off pull the other indices further down???
SP-500 has broken bearish rising wedge and the 20DMA on the daily chart. Currently testing the trend line from the Nov and Dec lows!!!
Russell 2000 has broken down from a consolidation period, broken through the 20 DMA and is testing the 50 DMA!!!
DJTRANS has broken the 20 and 50DMA!!!
Additionally the DJIA, NASDAQ COMPQ, NDX100, W4500 and the DAX have all broken 20 DMA!!! Will we follow the leaders? Food for thought...Apple is having an announcement day tomorrow for the IPAD 3. As in the past...prior to announcement APPLE stock rises and a day or so prior and/or afterwards usually sells off. Being Apple is such a large position on the Nasdaq will this sell off pull the other indices further down???
Attachments

jpcavin
TSP Legend
- Reaction score
- 97
Re: A2z1112 Account Talk
On the article that I posted on my account talk, the writer's system goes to sell if QQQ closes below 67.32. Will definitely take a look at market close today.
Looks like a H/S pattern on the NDX-100 possibly on the verge of breaking downward! As AAPL goes so does the COMPQ, NDX-100 and the SP-500!!! Food for thought for next week.
On the article that I posted on my account talk, the writer's system goes to sell if QQQ closes below 67.32. Will definitely take a look at market close today.

As I continue my TA education I realized that I was becoming to mioptic in my analysis. Primarily looking at just one indicie such as the SP-500 over specific time frames. I have begun to look at world markets as well as all of the US markets over various time frames, monthly, weekly daily etc. Above is a chart of the FTSE. This chart is reflective of what is also occurring in the CAC 40 and the DAX. These markets have topped in mid-March and have been making lower highs and lower lows since that time. They all have the same bearish H/S patterns which have broken the neckline and indicate the extent of the damage to be near their respective 200DMA. They all have broken their respective 20/50DMA. The FTSE chart is from yesterday's close. At the time of this posting the European markets are down anywhere from .38% (FTSE and CAC 40) to .85% (DAX).
The US markets are definitely at a crossroads as pointed out by a few members. The DJIA, W4500 and the RUT2000 have broken their respective 20 DMA and have closed below them. More importantly they have broken a 6 month trendline from their October/November lows!!! The SP-500, QQQ, and NDX closed yesterday in the vicinity of their respective 20DMA. The US futures at the time of this posting are down app. .40%. Will the US markets follow the European markets???? What do you think???
Sensei
TSP Pro
- Reaction score
- 33
I think you have some good points here. The DAX is actually now below its 50 day SMA, if I am not mistaken. There is a lot of empty space before the 200. But I don't think our indices are going to drop off a cliff just yet. My prediction is a test of the SPX 50 SMA. Then a rally to probably the 20. Lower high.View attachment 18479
As I continue my TA education I realized that I was becoming to mioptic in my analysis. Primarily looking at just one indicie such as the SP-500 over specific time frames. I have begun to look at world markets as well as all of the US markets over various time frames, monthly, weekly daily etc. Above is a chart of the FTSE. This chart is reflective of what is also occurring in the CAC 40 and the DAX. These markets have topped in mid-March and have been making lower highs and lower lows since that time. They all have the same bearish H/S patterns which have broken the neckline and indicate the extent of the damage to be near their respective 200DMA. They all have broken their respective 20/50DMA. The FTSE chart is from yesterday's close. At the time of this posting the European markets are down anywhere from .38% (FTSE and CAC 40) to .85% (DAX).
The US markets are definitely at a crossroads as pointed out by a few members. The DJIA, W4500 and the RUT2000 have broken their respective 20 DMA and have closed below them. More importantly they have broken a 6 month trendline from their October/November lows!!! The SP-500, QQQ, and NDX closed yesterday in the vicinity of their respective 20DMA. The US futures at the time of this posting are down app. .40%. Will the US markets follow the European markets???? What do you think???
Of course, I have no technical basis to make this prediction. Just going with my gut. Good luck.
(Actually, I just reviewed the DAX and Nasdaq - both gapped down significantly yesterday. So that would be my technical basis for the prediction. Short-term gap fill.)
Last edited:
MrJohnRoss
Market Veteran
- Reaction score
- 58
The US markets are definitely at a crossroads as pointed out by a few members. The DJIA, W4500 and the RUT2000 have broken their respective 20 DMA and have closed below them. More importantly they have broken a 6 month trendline from their October/November lows!!! The SP-500, QQQ, and NDX closed yesterday in the vicinity of their respective 20DMA. The US futures at the time of this posting are down app. .40%. Will the US markets follow the European markets???? What do you think???
Good analysis A2Z! I think there's a good possiblity that we're in a big topping process right now. As a result, I've moved to the lilly pad. Have you made any allocation changes to your TSP?
Thanks JR! I have attached a link to a CNBC video (4/2/2012) where Carter Worth, Chief Market Technician for Openheimer had some interesting analysis. Since the beginning of this bull market in March, 2009 there have been 11 corrections of 4% or more. After these corrections you saw the bull advance continue anywhere from 10-13 weeks before the next correction. We now are at the longest point since the bull market began without a correction, 15 weeks!!! He is calling for a healthy correction somwhere between 4% to 12%!!! The SP-500 is well advanced in an ascending wedge and today, if it holds, is the first time it will break below the wedge. The bottom trend line of the wedge is drawn from the Nov/Dec 2011 lows. So I agree we are getting very long in this market and are due for a correction. Maybe we rebound up a little before going lower. My wife and I moved to the G fund at the end of last month. I felt you landing on the lilly pad!!!
Talking Numbers: S&P Due for a Correction? - CNBC
Talking Numbers: S&P Due for a Correction? - CNBC
MrJohnRoss
Market Veteran
- Reaction score
- 58
Thanks JR! I have attached a link to a CNBC video (4/2/2012) where Carter Worth, Chief Market Technician for Openheimer had some interesting analysis. Since the beginning of this bull market in March, 2009 there have been 11 corrections of 4% or more. After these corrections you saw the bull advance continue anywhere from 10-13 weeks before the next correction. We now are at the longest point since the bull market began without a correction, 15 weeks!!! He is calling for a healthy correction somwhere between 4% to 12%!!! The SP-500 is well advanced in an ascending wedge and today, if it holds, is the first time it will break below the wedge. The bottom trend line of the wedge is drawn from the Nov/Dec 2011 lows. So I agree we are getting very long in this market and are due for a correction. Maybe we rebound up a little before going lower. My wife and I moved to the G fund at the end of last month. I felt you landing on the lilly pad!!!
Talking Numbers: S&P Due for a Correction? - CNBC
Thx A2Z, I'll check out the video tonight!
Sorry about shaking the lilly pad when I landed... looks like I need to lose a few more lbs of excess baggage! Lol! :toung:
Similar threads
- Replies
- 3
- Views
- 265