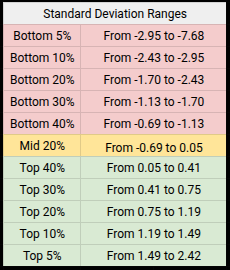
These past two sessions have given us 2 back-to-back Bottom 5% Deviations off the 63-Session Linear Regression Channel.
Typically these events cluster in scattered pockets and streaks.
A consecutive streak of 2 is the most common for the Bottom 5%
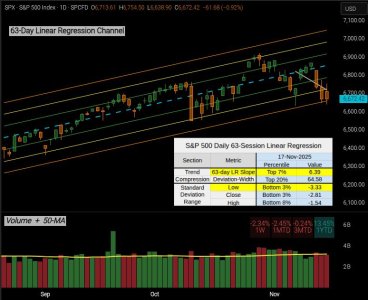
From 5040 Sessions, since this is a Bottom 5% Bucket, we have 252 events.
This Monday is Streak-2, it is the most common, thus has the most statistical support. But from the bird's eye view, that's 30 events from 20 years.
Here is the 3-6-9 Session Performance after a Streak:
The last time I discussed Clustered Bottom 5% Deviations, it was in reference to hard-coded Months and years. Now I want to focus on 9-Session Clusters. This entails Bottom 5% Deviations of 63-LR that fall within a 9-Session Window. We are measuring 3-6-9 Session Performance after a 9-Session Cluster has ended. Now beware, these stats may look good (and they are) but it does not address what you might have lost up to the point the 9-Session Cluster had ended.
I should also caveat this only addressed Bottom 5% Deviations, not the other 95%.
I have an entire table set aside for this, but within this context and present environment this was most prominent.
Soon, I'll be ready to introduce the S&P 500: State, Volatility & Breadth Matrix I just need a few minor tweaks, before it's ready.
Have a great Session.... Jason
Typically these events cluster in scattered pockets and streaks.
A consecutive streak of 2 is the most common for the Bottom 5%

From 5040 Sessions, since this is a Bottom 5% Bucket, we have 252 events.
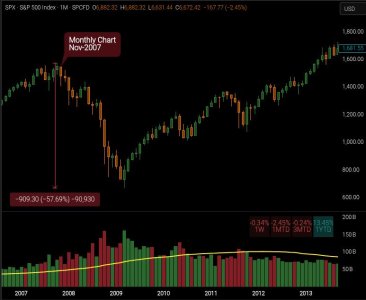
- In the A Rare November: Deviation vs. Trend Blog I stated we had not had more than 2 Bottom 5% Deviations in the month of November over the past 20 years.
- Well that wasn't true, we had 3 in Nov-2007 which closed the month down -4.40%
- And now we've had 3 in Nov-2025

This Monday is Streak-2, it is the most common, thus has the most statistical support. But from the bird's eye view, that's 30 events from 20 years.
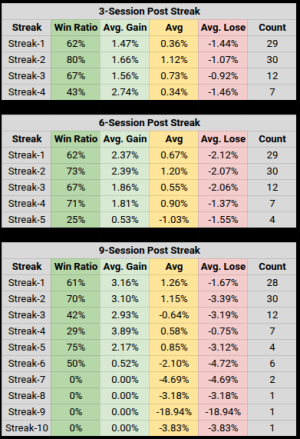
Here is the 3-6-9 Session Performance after a Streak:
- On the 3-Session Table, Stats on Streak-4 drop
- On the 6-Session Table, Stats on Streak-5 drop
- On the 9-Session Table, Stats on Streak-3 drop

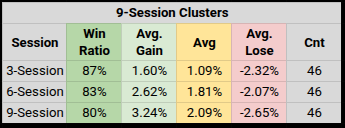
The last time I discussed Clustered Bottom 5% Deviations, it was in reference to hard-coded Months and years. Now I want to focus on 9-Session Clusters. This entails Bottom 5% Deviations of 63-LR that fall within a 9-Session Window. We are measuring 3-6-9 Session Performance after a 9-Session Cluster has ended. Now beware, these stats may look good (and they are) but it does not address what you might have lost up to the point the 9-Session Cluster had ended.

I should also caveat this only addressed Bottom 5% Deviations, not the other 95%.
I have an entire table set aside for this, but within this context and present environment this was most prominent.

Soon, I'll be ready to introduce the S&P 500: State, Volatility & Breadth Matrix I just need a few minor tweaks, before it's ready.
Have a great Session.... Jason
Last edited:
