Why 4-Months?
We get to explore a topic not often discussed.
It's an opportunity to examine stats from a broader perspective.
It fits neatly within a year, so we have three 4-Month periods to compare.
Lastly, it's a time-frame perhaps better suited for folks who IFT sparingly, only 9 of 2024's Auto-Tracker Top-50 used an IFT.
While the first 4-Months have the 2nd best win ratio, we also the have the best gains and the lowest losses.
62% of the time the S&P 500 had an average 4-Month gain of 8.91%
38% of the time the S&P 500 had an average 4-Month loss of -4.98%
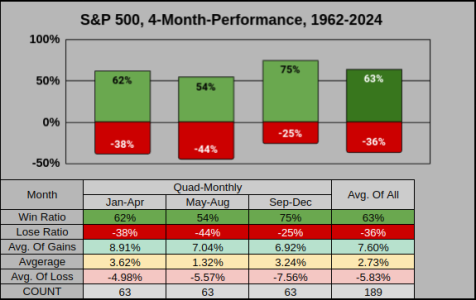
Comparing Jan-Apr on a rolling 4-Month time-frame.
The win ratio isn't overly impressive, ranking 10th best of 12.
But the average of gains was 2nd best (just a hair short of Oct-Jan).
For average of losses, when we did lose, Jan-Apr have the lowest 4-Month lose.
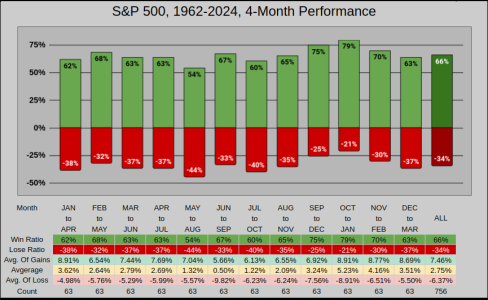
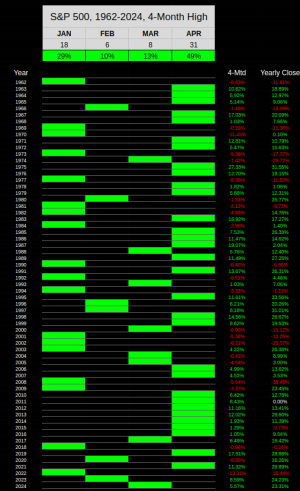
So where is it probable to find the 4-Month High from Jan-Apr?
From Jan-Apr, April has 49% of the highs.
Of the 31 times April was the Jan-Apr high, the year closed positive 29 times.
So "roughly" speaking, when Apr was the 4-month high, the year closed positive 95% of the time.
That's the good news, here's the bad news.
From Jan-Apr, Jan has 29% of the highs.
Of the 18 times Jan was the Jan-Apr high, the year closed negative 12 times.
So "roughly" speaking, when Jan was the 4-month high, the year closed negative 66% of the time.
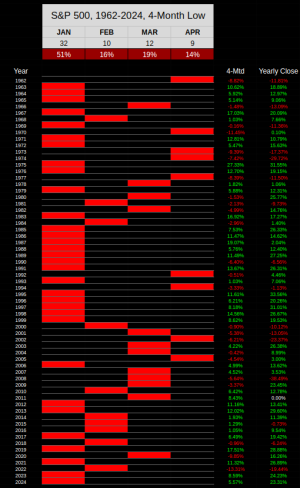
So where is it probable to find the 4-Month Low from Jan-Apr?
From Jan-Apr, Jan has 51% of the lows.
Of the 32 times Jan was the Jan-Apr low, the year closed positive 30 times.
So "roughly" speaking, when Jan was the 4-month low, the year closed positive 94% of the time.
That's the good news, here's the bad news.
From Jan-Apr, Apr has 14% of the lows.
Of the 9 times Apr was the Jan-Apr low, the year closed negative 6 times.
So "roughly" speaking, when Apr was the 4-month low, the year closed negative 67% of the time.
Of the 3 times Apr was the Jan-Apr low, but the year closed positive, the gains were not impressive.
1992 at 4.46%, 2005 at 3.00% and 1970 at .10%
To summarize the previous two High/Low charts.
When the Index was positive April YTD, the index closed positive 38 of 39 times giving us a 97% win ratio. In those instances, Apr was the 4-month high 31 of 39 times.
When the Index was negative April YTD, the index closed negative 15 of 24 times giving us a 38% win ratio. In those instances, Apr was the 4-month low 9 of 24 times.
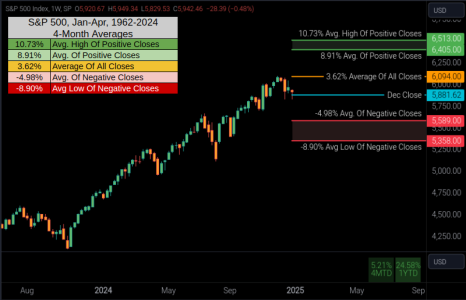
Correlating 1962-2024's statistical averages with 2025, here's how the first 4-Months look. Please bare in mind this is a 4-Month view, I also post the Yearly view from time-to-time. Additionally, this year I've changed the stats, positive stats are only counted if the year closed positive, and negative stats if the year closed down. The weekly chart shows buyers may want to add risk below 5589 & sellers may want to reduce risk above 6405.
Wrapping this up with some final thoughts and data. It's been well advertised that after 2 years of substantial gains, market pundits are already low-balling 2025. I can't speak to this, but we can look at the data for some insight.
Since we're looking at 2-3 year performance I'll go back 100 years to 1925 so we can pull from a larger sample of data.
For 2-year performance, 2023-2024 ranked 11th best of 101 2-year increments.
Of the 79 2-year increments which closed positive, the 3rd year closed higher 67% of the time.
So from 79 positive 2-year events, 67% of the time, the 3rd year closed positive with an average gain of 18.57%.
Or the index closed the 3rd year down 33% of the time with an average loss of -11.74%
But... of the 26 times the 3rd year closed down, 6 times the loss was less than -3%
Thanks for reading and have a great year...Jason
We get to explore a topic not often discussed.
It's an opportunity to examine stats from a broader perspective.
It fits neatly within a year, so we have three 4-Month periods to compare.
Lastly, it's a time-frame perhaps better suited for folks who IFT sparingly, only 9 of 2024's Auto-Tracker Top-50 used an IFT.
While the first 4-Months have the 2nd best win ratio, we also the have the best gains and the lowest losses.
62% of the time the S&P 500 had an average 4-Month gain of 8.91%
38% of the time the S&P 500 had an average 4-Month loss of -4.98%

Comparing Jan-Apr on a rolling 4-Month time-frame.
The win ratio isn't overly impressive, ranking 10th best of 12.
But the average of gains was 2nd best (just a hair short of Oct-Jan).
For average of losses, when we did lose, Jan-Apr have the lowest 4-Month lose.

So where is it probable to find the 4-Month High from Jan-Apr?
From Jan-Apr, April has 49% of the highs.
Of the 31 times April was the Jan-Apr high, the year closed positive 29 times.
So "roughly" speaking, when Apr was the 4-month high, the year closed positive 95% of the time.
That's the good news, here's the bad news.
From Jan-Apr, Jan has 29% of the highs.
Of the 18 times Jan was the Jan-Apr high, the year closed negative 12 times.
So "roughly" speaking, when Jan was the 4-month high, the year closed negative 66% of the time.

So where is it probable to find the 4-Month Low from Jan-Apr?
From Jan-Apr, Jan has 51% of the lows.
Of the 32 times Jan was the Jan-Apr low, the year closed positive 30 times.
So "roughly" speaking, when Jan was the 4-month low, the year closed positive 94% of the time.
That's the good news, here's the bad news.
From Jan-Apr, Apr has 14% of the lows.
Of the 9 times Apr was the Jan-Apr low, the year closed negative 6 times.
So "roughly" speaking, when Apr was the 4-month low, the year closed negative 67% of the time.
Of the 3 times Apr was the Jan-Apr low, but the year closed positive, the gains were not impressive.
1992 at 4.46%, 2005 at 3.00% and 1970 at .10%

To summarize the previous two High/Low charts.
When the Index was positive April YTD, the index closed positive 38 of 39 times giving us a 97% win ratio. In those instances, Apr was the 4-month high 31 of 39 times.
When the Index was negative April YTD, the index closed negative 15 of 24 times giving us a 38% win ratio. In those instances, Apr was the 4-month low 9 of 24 times.
Correlating 1962-2024's statistical averages with 2025, here's how the first 4-Months look. Please bare in mind this is a 4-Month view, I also post the Yearly view from time-to-time. Additionally, this year I've changed the stats, positive stats are only counted if the year closed positive, and negative stats if the year closed down. The weekly chart shows buyers may want to add risk below 5589 & sellers may want to reduce risk above 6405.

Wrapping this up with some final thoughts and data. It's been well advertised that after 2 years of substantial gains, market pundits are already low-balling 2025. I can't speak to this, but we can look at the data for some insight.
Since we're looking at 2-3 year performance I'll go back 100 years to 1925 so we can pull from a larger sample of data.
For 2-year performance, 2023-2024 ranked 11th best of 101 2-year increments.
Of the 79 2-year increments which closed positive, the 3rd year closed higher 67% of the time.
So from 79 positive 2-year events, 67% of the time, the 3rd year closed positive with an average gain of 18.57%.
Or the index closed the 3rd year down 33% of the time with an average loss of -11.74%
But... of the 26 times the 3rd year closed down, 6 times the loss was less than -3%
Thanks for reading and have a great year...Jason
