Well, our latest sentiment survey not only kept up its upward bullish trend, it blew it out of the water. And in so doing flipped the signal from a buy to a sell. Here's the sentiment survey results since mid-August. Notice how low bullish sentiment has been overall and how it's slowly risen since the 09/27 survey.
11/08/10 - 11/12/10 70% 23% 3.04 -1 Sell G Bull
11/01/10 - 11/05/10 55% 35% 1.57 -1 3.60% 1225.85 Buy S Bull
10/25/10 - 10/29/10 54% 36% 1.50 -1 0.02% 1183.26 Buy S Bull
10/18/10 - 10/22/10 51% 36% 1.42 -1 0.59% 1183.08 Buy S Bull
10/11/10 - 10/15/10 47% 38% 1.24 -1 0.95% 1176.19 Buy S Bull
10/04/10 - 10/08/10 46% 43% 1.07 -1 1.65% 1165.15 Buy S Bull
09/27/10 - 10/01/10 35% 55% 0.64 -1 -0.21% 1146.24 Buy S Bull
09/20/10 - 09/24/10 37% 52% 0.71 -1 2.05% 1148.67 Sell G Bear
09/13/10 - 09/17/10 44% 43% 1.02 -1 1.45% 1125.59 Sell G Bear
09/07/10 - 09/10/10 38% 53% 0.72 -1 0.46% 1109.55 Buy C Bear
08/30/10 - 09/03/10 29% 60% 0.48 -1 3.75% 1104.51 Buy C Bear
08/23/10 - 08/27/10 38% 48% 0.79 -1 -0.66% 1064.59 Buy S Bull
08/16/10 - 08/20/10 29% 63% 0.46 -1 -0.70% 1071.69 Buy S Bull
Now in spite of the current sentiment survey sell signal, the Seven Sentinels remain on a buy. But the Sentinels are an Intermediate Term system and may not flip to a sell on short term weakness. And given how BPCOMPQ looks after Friday, I doubt the system can flip to a sell without some serious selling pressure.
But the survey's sell signal has been gold for most of this year and is now suggesting weakness may be close at hand so it may be worth the IFT to have some cash on hand should a buying opportunity present itself.
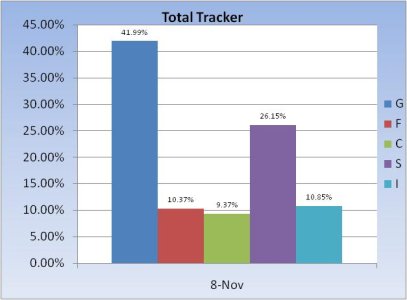
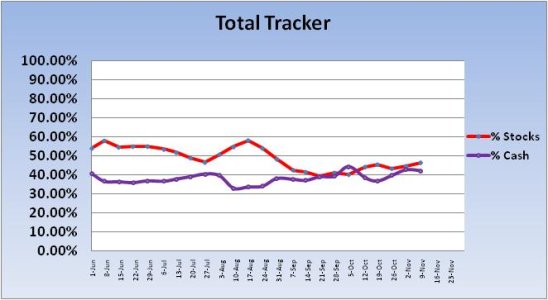
Interestingly, our strong bullish sentiment is still not translating into a strong bullish stock position for the Total Tracker chart. It did move higher, but only by a very modest amount. Here's the charts:


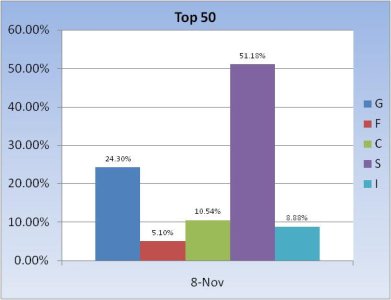
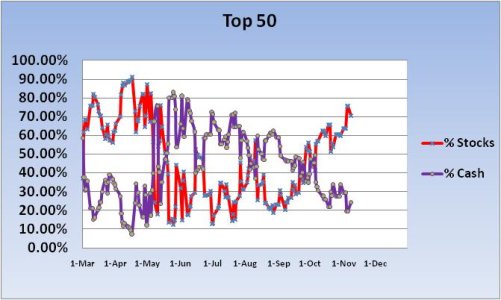
The Top 50 are solidly bullish after last week's run higher and the S fund continues to be the fund of choice, which is interesting given the potential for the I fund to outperform if the dollar makes a move lower. But that's a big "if". There does appear to be some profit taking this past week, which is probably due to the sentiment sell signal.


We can see not much has changed after last week. Again, there was a very modest shift to stocks with a corresponding drop in cash, but given this week's sentiment survey results we still aren't embracing this market.
Signals greater than 2.0 are uncommon, but how did they play out?
05/03/10 - 05/07/10 64% 25% 2.56 -1 -6.39% 1110.88 Sell G Bull
04/19/10 - 04/23/10 61% 29% 2.10 -1 2.11% 1217.28 Sell G Bull
01/19/10 - 01/22/10 58% 25% 2.32 -1 -3.90% 1091.76 Sell G Bull
12/28/09 - 12/31/09 66% 20% 3.30 -1 -1.01% 1115.10 Sell G Bull
12/21/09 - 12/24/09 63% 26% 2.42 -1 2.18% 1126.48 Sell G Bull
12/14/09 - 12/18/09 62% 28% 2.21 -1 -0.36% 1102.47 Sell G Bull
12/07/09 - 12/11/09 58% 28% 2.07 -1 0.04% 1106.41 Sell G Bull
Since January 2009 we've had seven surveys with a reading greater than 2%. Of those four of them saw lower prices the following week. Two of them saw higher prices above 2%, while one was practically flat.
The sell signals that saw negative returns totaled -11.66%.
The sell signals that saw positive returns totaled 4.33%.
So while it's not a given that next week will see lower prices, it may be worth the risk to test that sell signal.
11/08/10 - 11/12/10 70% 23% 3.04 -1 Sell G Bull
11/01/10 - 11/05/10 55% 35% 1.57 -1 3.60% 1225.85 Buy S Bull
10/25/10 - 10/29/10 54% 36% 1.50 -1 0.02% 1183.26 Buy S Bull
10/18/10 - 10/22/10 51% 36% 1.42 -1 0.59% 1183.08 Buy S Bull
10/11/10 - 10/15/10 47% 38% 1.24 -1 0.95% 1176.19 Buy S Bull
10/04/10 - 10/08/10 46% 43% 1.07 -1 1.65% 1165.15 Buy S Bull
09/27/10 - 10/01/10 35% 55% 0.64 -1 -0.21% 1146.24 Buy S Bull
09/20/10 - 09/24/10 37% 52% 0.71 -1 2.05% 1148.67 Sell G Bear
09/13/10 - 09/17/10 44% 43% 1.02 -1 1.45% 1125.59 Sell G Bear
09/07/10 - 09/10/10 38% 53% 0.72 -1 0.46% 1109.55 Buy C Bear
08/30/10 - 09/03/10 29% 60% 0.48 -1 3.75% 1104.51 Buy C Bear
08/23/10 - 08/27/10 38% 48% 0.79 -1 -0.66% 1064.59 Buy S Bull
08/16/10 - 08/20/10 29% 63% 0.46 -1 -0.70% 1071.69 Buy S Bull
Now in spite of the current sentiment survey sell signal, the Seven Sentinels remain on a buy. But the Sentinels are an Intermediate Term system and may not flip to a sell on short term weakness. And given how BPCOMPQ looks after Friday, I doubt the system can flip to a sell without some serious selling pressure.
But the survey's sell signal has been gold for most of this year and is now suggesting weakness may be close at hand so it may be worth the IFT to have some cash on hand should a buying opportunity present itself.
Interestingly, our strong bullish sentiment is still not translating into a strong bullish stock position for the Total Tracker chart. It did move higher, but only by a very modest amount. Here's the charts:


The Top 50 are solidly bullish after last week's run higher and the S fund continues to be the fund of choice, which is interesting given the potential for the I fund to outperform if the dollar makes a move lower. But that's a big "if". There does appear to be some profit taking this past week, which is probably due to the sentiment sell signal.


We can see not much has changed after last week. Again, there was a very modest shift to stocks with a corresponding drop in cash, but given this week's sentiment survey results we still aren't embracing this market.
Signals greater than 2.0 are uncommon, but how did they play out?
05/03/10 - 05/07/10 64% 25% 2.56 -1 -6.39% 1110.88 Sell G Bull
04/19/10 - 04/23/10 61% 29% 2.10 -1 2.11% 1217.28 Sell G Bull
01/19/10 - 01/22/10 58% 25% 2.32 -1 -3.90% 1091.76 Sell G Bull
12/28/09 - 12/31/09 66% 20% 3.30 -1 -1.01% 1115.10 Sell G Bull
12/21/09 - 12/24/09 63% 26% 2.42 -1 2.18% 1126.48 Sell G Bull
12/14/09 - 12/18/09 62% 28% 2.21 -1 -0.36% 1102.47 Sell G Bull
12/07/09 - 12/11/09 58% 28% 2.07 -1 0.04% 1106.41 Sell G Bull
Since January 2009 we've had seven surveys with a reading greater than 2%. Of those four of them saw lower prices the following week. Two of them saw higher prices above 2%, while one was practically flat.
The sell signals that saw negative returns totaled -11.66%.
The sell signals that saw positive returns totaled 4.33%.
So while it's not a given that next week will see lower prices, it may be worth the risk to test that sell signal.
