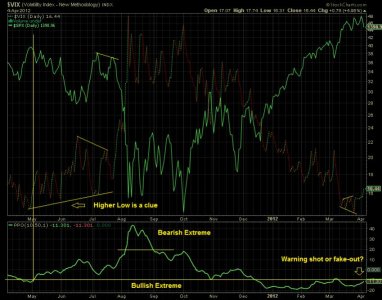
The VIX moved up today (4/04) and posted a high at 17.44 before falling into the close at 16.44, a 4.98% increase. The VIX low for the year, so far, has touched 14.26. Unlike most tools in technical analysis, VIX is a forward looking metric and is widely known as a “fear gage” for the market. It trends opposite the SP 500 index. Because it has futuristic powers, it is very important to keep an eye on.
For review, when the VIX rises, more bets are made that the equities market may fall (put options are bought), or alternatively used as a hedge against a long position. When the VIX falls, there is an expectation of continuing bullish behavior in the market, and fear subsides to complacency. It is constructed using SPX 500 index options for 30 days ahead, using near term and longer term options from the Chicago Board Options Exchange (CBOE). There are several formulas for computation, but that is beyond the scope of this discussion.

The trend is not really that informative as we see today. Is VIX at 16.44 good or bad? Fortunately there is a clever trick to define extremes using the Percent Price Oscillator (PPO), as viewed in the lower panel on the chart. This tool determines the percentage difference between two exponential moving averages (ema). PPO values for the VIX on the chart below -10 track extreme bullish behavior; while values above 20-25 track extreme bearish behavior. You can see the market has been in extreme bullish territory since mid December 2011, except for a slight breach in early March. Levels above -10 for any length of time should spell trouble for the market. Today’s PPO for the VIX closed at -11.3, so technically little harm has been done. However, it bears watching as it is trending up.
Also of note; from May–July, 2011 while slow price deterioration in SP 500 was occurring there were higher lows in the VIX. So, higher lows seem to me to be a warning. We have yet to see a higher low, but may see one soon. Remember, VIX is our futurist.
For review, when the VIX rises, more bets are made that the equities market may fall (put options are bought), or alternatively used as a hedge against a long position. When the VIX falls, there is an expectation of continuing bullish behavior in the market, and fear subsides to complacency. It is constructed using SPX 500 index options for 30 days ahead, using near term and longer term options from the Chicago Board Options Exchange (CBOE). There are several formulas for computation, but that is beyond the scope of this discussion.

The trend is not really that informative as we see today. Is VIX at 16.44 good or bad? Fortunately there is a clever trick to define extremes using the Percent Price Oscillator (PPO), as viewed in the lower panel on the chart. This tool determines the percentage difference between two exponential moving averages (ema). PPO values for the VIX on the chart below -10 track extreme bullish behavior; while values above 20-25 track extreme bearish behavior. You can see the market has been in extreme bullish territory since mid December 2011, except for a slight breach in early March. Levels above -10 for any length of time should spell trouble for the market. Today’s PPO for the VIX closed at -11.3, so technically little harm has been done. However, it bears watching as it is trending up.
Also of note; from May–July, 2011 while slow price deterioration in SP 500 was occurring there were higher lows in the VIX. So, higher lows seem to me to be a warning. We have yet to see a higher low, but may see one soon. Remember, VIX is our futurist.
