Last week I said I was looking higher in spite of our overly bullish sentiment survey, but that I thought sentiment would still deliver some weakness during the course of the week. Monday through Wednesday gave us that weakness. That validated the sentiment. And I had two main reasons that I felt we'd end the week higher. First, was the fact that our auto-tracker showed a drop in stock allocations. That has been bullish all year. Second, underlying market support was still quite high. I felt that as long as that remained the case, the downside would be limited, which might give the market a decent chance to end the week higher. And that is pretty much how things played out as we were down the first part of the week and rallied the last two days. The S and I funds were just barely positive on the week, but the C fund (S&P 500) managed to post a 0.42% gain.
This week, our sentiment survey is still overly bullish, although not quite as much as the previous week. I think we can anticipate some degree of selling pressure again, but liquidity is still quite high so I am not looking for significant downside action.

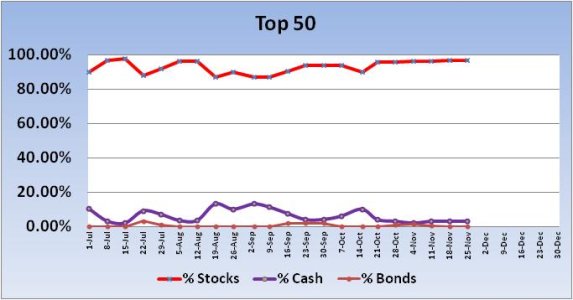
The Top 50 had no change in stock allocations, which remained at 96.88%. That's bullish longer term.

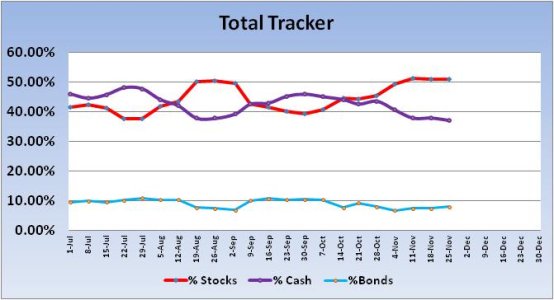
The Total Tracker (Auto-Tracker) saw a modest increase in stock exposure. No signals were generated for the new week.

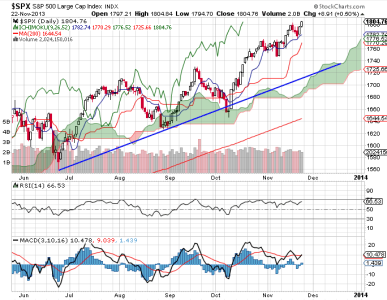
New all-time highs again for the S&P. The chart remains extended, but MACD and RSI are not bearish. And neither are the moving averages that are used in Ichimoku charting. RSI remains strong and is not overbought, while momentum is positive, but tracking largely sideways. The chart remains bullish.

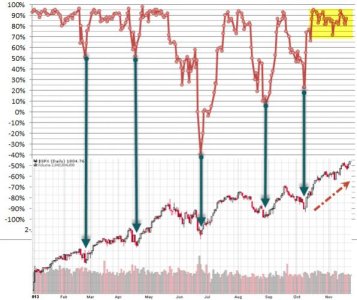
This chart really says a lot about how this year has gone. There are actually 2 charts. The top one shows relative liquidity levels over the course of the year. Levels above 0% are indicating liquidity in expansion. That is, money is flowing into the market. Levels below 0% show liquidity in contraction, or money being pulled out of the market. The chart below is the S&P 500. Price of the S&P 500 has tracked pretty much in sync with liquidity. I drew some arrows from the low points of liquidity and they match up with dips in the S&P 500. I could have done the same thing with the peaks.
The yellow highlighted area shows liquidity levels since the last "significant" dip. Those levels have stayed very elevated since that time. This is why I keep saying that unless liquidity drops off, the downside is likely to remain limited.
If it wasn't for liquidity, I'd be inclined to be more bearish on our sentiment. It's also a holiday week that may see low volume. That may be a prescription for the market to bias higher too.
With Thanksgiving just around the corner, I'd like to thank all of our brave service men and women for their selfless service to our country. Especially those that are not able to be with family at this time of the year. Your sacrifice does not go unnoticed and we pray for your safe return.
To see this week's full analysis, follow this link TSP Talk Members' Home Page
This week, our sentiment survey is still overly bullish, although not quite as much as the previous week. I think we can anticipate some degree of selling pressure again, but liquidity is still quite high so I am not looking for significant downside action.

The Top 50 had no change in stock allocations, which remained at 96.88%. That's bullish longer term.

The Total Tracker (Auto-Tracker) saw a modest increase in stock exposure. No signals were generated for the new week.

New all-time highs again for the S&P. The chart remains extended, but MACD and RSI are not bearish. And neither are the moving averages that are used in Ichimoku charting. RSI remains strong and is not overbought, while momentum is positive, but tracking largely sideways. The chart remains bullish.

This chart really says a lot about how this year has gone. There are actually 2 charts. The top one shows relative liquidity levels over the course of the year. Levels above 0% are indicating liquidity in expansion. That is, money is flowing into the market. Levels below 0% show liquidity in contraction, or money being pulled out of the market. The chart below is the S&P 500. Price of the S&P 500 has tracked pretty much in sync with liquidity. I drew some arrows from the low points of liquidity and they match up with dips in the S&P 500. I could have done the same thing with the peaks.
The yellow highlighted area shows liquidity levels since the last "significant" dip. Those levels have stayed very elevated since that time. This is why I keep saying that unless liquidity drops off, the downside is likely to remain limited.
If it wasn't for liquidity, I'd be inclined to be more bearish on our sentiment. It's also a holiday week that may see low volume. That may be a prescription for the market to bias higher too.
With Thanksgiving just around the corner, I'd like to thank all of our brave service men and women for their selfless service to our country. Especially those that are not able to be with family at this time of the year. Your sacrifice does not go unnoticed and we pray for your safe return.
To see this week's full analysis, follow this link TSP Talk Members' Home Page
