It certainly appears that way. After the gigantic white candle on Friday from the European bank bailout news, the SPX has nearly reached the previous momentum high from June, 19: 1363 vs.1362 at the close. Whether this is a double top or not will become apparent real soon. Because the market is extremely overbought, a pullback to the 1340 area is likely in the next few sessions. However, the market may drift even a little higher first. This is because lower volume holiday trading has a positive bias. If this is the real deal for an intermediate trend, SPX targets could be as high as 1396 for the current intermediate wave 3 (wave 1: 1267-1363, wave 2: 1363-1309, and wave 3: 1309-1362 underway). This is the bull count and five waves up would unfold.
A contrary bear view insists that the ABC move has ended (1267-1363-1309-1362 or the reversal point). Preferably the end would be with Fridays high, and a downtrend should emerge soon, trending to the low near 1200.
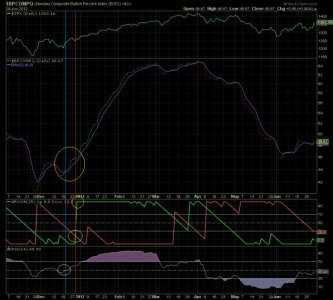
To further investigate whether the intermediate trend is commencing, I plotted the bullish percent of the Nasdaq Composite in the chart below. Back in December, 2011 when the RSI exceeded 50 (blue vertical line) and the Aroon (trend indicator) up line crossed the down line and quickly rose to 100 and stayed there (red vertical line); signaled the intermediate trend was firmly underway. At the moment neither the RSI is above 50 (45.90), or the Aroon up line has crossed moving towards 100. But the trend is firmly up, so this could all change in a hurry. I expect a resolution by the end of the holiday week or a little later. My uptrend cube has turned to buy for C, S and I, but needs confirmation with an advance taking out the double top, preferably with a minor wave down, and reversing upwards to new highs. Thanks for reading.

