Twodaystocks' account talk

Your mention of pulling out of 'C' on your other thread may not be too bad. If you notice, there was a major pullback at close....Smart Money taking profits.
 
Personal portfolio holdings as of 6 dec 2012, URTY, XHB, EDC, DRN, and GILD. All with a trailing 1.5% trailing stop except GILD, which I am holding because of a HEP B drug awaiting FDA approval in 2013.
 
Personal portfolio holdings as of 6 dec 2012, URTY, XHB, EDC, DRN, and GILD. All with a trailing 1.5% trailing stop except GILD, which I am holding because of a HEP B drug awaiting FDA approval in 2013.

Stopped out URTY and XHB, market order placed for GASL, Natural Gas 3x leveraged ETF because of chatter on CNBC regarding US starting to export it.
 
Picked up some SRTY today because of continued market uncertainty. SRTY is the ProShares UltraShort for the Russel 2000. The chart looks to have formed a base around $37 and has cleared its downward trendline horizontally. Placing a stop a little lower this time at 3%.

6 Dec 12 URTY daily chart.jpg
 
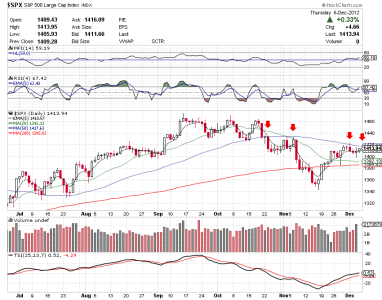
The 50 moving average has been tough resistance for the S&P. It hasn't closed above that level sincethe 18th of October. I'll be watching the 50 as a resistance level. If it closes above its 50 tomorrow, Ill probably be a buyer on Monday. The DAILY chart below shows what I am referring to.

6 Dec 12 C fund Daily resistance.png

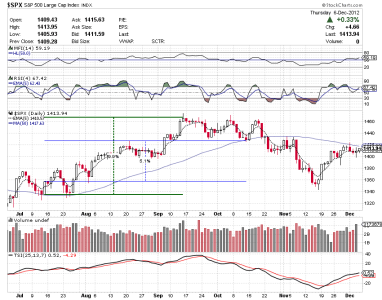
When the index closes above its own 50 day moving average, I hope for a run as strong as, or preferrably stronger than its previous run which started on 13 July 2012 and didn't close at/below its 50 until 12 Oct 2012. From the first close above its 50 ma, to its first close at/below its 50, it would have netted a 5.1% profit. Had I bought in directly at its 50 day level in July and sold at its highest close on 14 Sep 2012, which happens to by my birthday, I would have netted almost 10% return. If it clears its 50 tomorrow, I look for a price target of around 1550 by EOM Feb or mid month March. The chart below shows more clearly what I am referring to.
6 Dec 12 C fund 50 bull run.png
 
Great reasoning "twodaystocks". You give me much hope for the Spring of the new year.

The 50 moving average has been tough resistance for the S&P. It hasn't closed above that level sincethe 18th of October. I'll be watching the 50 as a resistance level. If it closes above its 50 tomorrow, Ill probably be a buyer on Monday. The DAILY chart below shows what I am referring to.

View attachment 21394

When the index closes above its own 50 day moving average, I hope for a run as strong as, or preferrably stronger than its previous run which started on 13 July 2012 and didn't close at/below its 50 until 12 Oct 2012. From the first close above its 50 ma, to its first close at/below its 50, it would have netted a 5.1% profit. Had I bought in directly at its 50 day level in July and sold at its highest close on 14 Sep 2012, which happens to by my birthday, I would have netted almost 10% return. If it clears its 50 tomorrow, I look for a price target of around 1550 by EOM Feb or mid month March. The chart below shows more clearly what I am referring to.
 
Last edited:
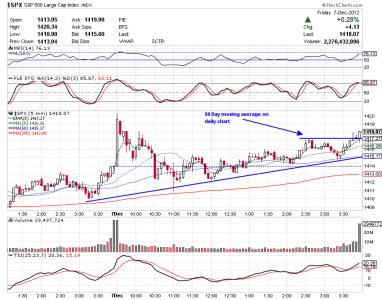
The C fund closed out the week higher on the intraday, daily, and weekly chart. I got scared out when it hit 1402 earlier this week so I didn't get the full gain.

The intraday chart looked like the market sold off a bit early in the mroning and then made a slow climb back to close above 1418, but with no selling after 315pm, I think it needs to have a short pullback before going higher.

7 dec 12 c fund intraday.png

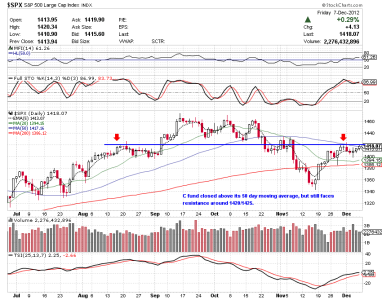
The daily chart closed fractionally above its 50 day moving average, helped in part by the lack of selling after 315 when the market went straight up until the close. I still see some resistance around the 1420/1425 level that has been there most of the year.

7 dec 12 c fund daily.png

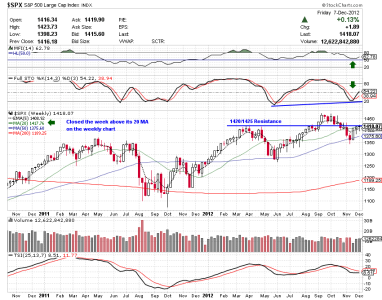
The weekly chart closed fractionally above its 20 day moving average, the stochastics indicator is looking bullish, the Money Flow Indicator is turning positive, and the TSI looks to be nearing a bullish cross. In a normal market, I would love to be in, but right now, i am still uncertain.

7 dec 12 c fund weekly.png
 
In a normal market...

Hi twodays - Sorry to bring this up in your thread, but you're the most recent one to use the above phrase, which always leads me to ask myself, "What is a 'normal market'?" I guess I ask the question half seriously, and half tongue-in-cheek. I've only been following the stock market since 2010, so everything about it has always been unpredictable to me. Was there ever a time when this was not the case? Looking at long term charts of the S&P 500, it seems that there were several decades of growth where you could just buy and hold and forget about even following the market, secure that you'd have more money in the end. Is that a "normal market"? If so, it doesn't seem to me like that will ever be a reality again in our country.

Thanks for contributing your charts. It's always nice to see others' perspectives. :)
 
If we can get our Manufacturing base back that would be the time. That surely won't happen within the next 4 years.
 
Hi twodays - Sorry to bring this up in your thread, but you're the most recent one to use the above phrase, which always leads me to ask myself, "What is a 'normal market'?" I guess I ask the question half seriously, and half tongue-in-cheek. I've only been following the stock market since 2010, so everything about it has always been unpredictable to me. Was there ever a time when this was not the case? Looking at long term charts of the S&P 500, it seems that there were several decades of growth where you could just buy and hold and forget about even following the market, secure that you'd have more money in the end. Is that a "normal market"? If so, it doesn't seem to me like that will ever be a reality again in our country.

Thanks for contributing your charts. It's always nice to see others' perspectives. :)

Good point. Maybe this is the new normal? I just feel that right now, I can't predict at all where the market is going. It seemed like last year when Gold hit over $1800/ounce, it was some what of a hedge to the markets. Now, it seems like it is moving in unison with them.? I am still learning, and I think with investing, you always have to be learning. I know some investors LOVE the volatility right now, but they have the freedom to move in and out more freely than we can. If I solely judge by the charts, I should be all in, but with the political grudge match going on, I am not afraid to say I am nervous about putting my money in right now. Some say the markets have already priced in the cliff being resolved, others say the markets have priced in the cliff NOT being resolved. I disagree with both. I think markets right now are purely "washington" news driven. Also, with so many corps offering early div's, the cliff seems to be a much larger issue than I think some people understand. Maybe I just don't have enough experience to see that this is the way the markets have been for a while. Who knows.

A great quote I heard recently said, "you don't have to know or understand WHY the markets are moving, you only have to know what to do once they move."

I'll be watching for some clarity this week, but with the deadline moving closer and closer, I believe the markets will begin to get a little more bearish until we hear some news.
 
Got stopped out of GASL for a loss today. EDC up almost 8%, DRN up nearly 3%, GILD down .4%, and SRTY down 1.25%.

On my radar: MNKD

10 Dec MNKD chart.jpg
 
I'm still long EDC, up almost 11%; GILD up 2.3%; JVA down almost .5%; TECL up 1.11%, and GASL up 2.75%. Sticking with my trailing stops on all of those. It's nice to see the S&P staying above its 50ma on the daily chart. I/m 100% back in C fund as of COB yesterday.
 
I'm still long EDC, up almost 11%; GILD up 2.3%; JVA down almost .5%; TECL up 1.11%, and GASL up 2.75%. Sticking with my trailing stops on all of those. It's nice to see the S&P staying above its 50ma on the daily chart. I/m 100% back in C fund as of COB yesterday.

nice trades man, good luck with the C fund, cause I'm in there with ya haha.
 
Long DRV today. Tight trailing stop at 1.5% for this one. Its above its 5 ema and so far, the low of the day is also the open of the day. We will see.
 
Back
Top