tsptalk's Market Talk

Afraid I don't have this sub-section of stats anymore, I lost them when my OS crashed, I'll have to rebuild them, but that takes some time because each holiday is unique.

Looking at last year's almanac trader, it states: "Every down January on the S&P since 1950, without exception, was followed by a new or continuing bear market, a flat year, or a 10% correction. Down January's were followed by substantial declines averaging minus 13.9% providing excellent buying opportunities later in most years.

You guys have been investing much, much longer than me. How much weight do you put into statistics? Is this something that you take with a grain of salt or is it another part of the equation used to arrive at a decision?

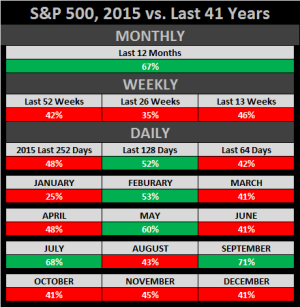
Here's my personal speculation on this topic. Since markets go up most of the time, the stats I post should be more accurate under bullish conditions, and less so under bearish conditions.

As you can see from the chart below, 2015 was not an accurate year, the monthly timeframe was pretty good, but the weekly sucked, and the daily was only accurate 5 of 12 months.

Untitled.png
 
Maybe try doing stats just on 2000-2001, 2007-2009, 2011??? I don't know... just thinking maybe to study the bearish periods and do stats based on just that since we do seem to be going that way.

I have been studying those years very intently. Looking at the price and up/down swings in relationship to the various MAs, MA crossovers, Slow Stochastic, MACD and RSI and Bollinger Bands--including all of these indicator's slopes. Looking for best patterns that would have kept you out of trouble during those awful periods and what specific parameters could be most reliably used to make a safe/profitable short-term entry.

I think I have concluded what many have said. You can't predict what the market will do. It can do anything. So trying to make decision using a strategy that includes a mix of indicators mentioned above (based on best recipe I could figure out for entry and exit), sentiment, seasonality and news (as best I can get)----Whewwwwwww..... this is time-consuming.


Best Wishes to you and to everyone on your investments!!!!!!!! :smile:
 
Maybe try doing stats just on 2000-2001, 2007-2009, 2011??? I don't know... just thinking maybe to study the bearish periods and do stats based on just that since we do seem to be going that way.

This is where it gets tricky due to the lack of data, and the potential of "cherry picking" the stats in the same way some folks might alter their indicators to fit specific time frames, then think they have a forward-looking system that will yield the same results as the past. In particular, the year 2001-2009 bear market really skews the data, since there is no other Bear market like it.

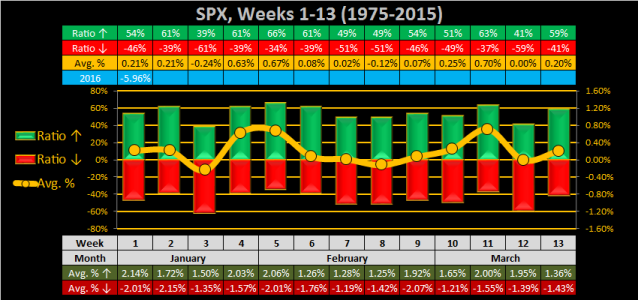
The best compromise I've found is to look at the Negative Average Returns listed as "Avg. % ↓" which is listed in the bottom row. This data only counts the events when the market closed down, therefore it is a good way for the person with a bearish mindset, to ponder what their potential loss might be.

2016 - Week 02 - Weekly - SPX.png
 
So does this translate as next week is the third (bad) week?
This is where it gets tricky due to the lack of data, and the potential of "cherry picking" the stats in the same way some folks might alter their indicators to fit specific time frames, then think they have a forward-looking system that will yield the same results as the past. In particular, the year 2001-2009 bear market really skews the data, since there is no other Bear market like it.

The best compromise I've found is to look at the Negative Average Returns listed as "Avg. % ↓" which is listed in the bottom row. This data only counts the events when the market closed down, therefore it is a good way for the person with a bearish mindset, to ponder what their potential loss might be.

View attachment 36678
 
Thanks JTH. I still expect a rally and I think we'll get a doozy soon after oil bottoms. The OPEC policy decision is costing everyone: Russia, Saudia Arabia, Argentina, US, and other oil producers: a bundle. And for what...market share isn't going to change. This is a man-made problem and needs a man-made solution. Once these guys decide they've had enough pain and want to complete their secret backdoor negotiations, there will be a surprise announcement and walla... instant rally to new ATHs....Just no idea when that happens or what happens after..

FS
 
Testing the Sept. low. August's next?

011516a.gif
 
Armstrong says 15940 is important. The DOW leaned over to almost kiss that at 16002 but got up to 16026 now, ...waiting for the close. Armstrong says up and down til Feb 8 then I guess he's saying we will know if it's over or if it's a pause, enroute. :) Where is our liaison with Ferdinand when we need him? The Dow and 15940 | Armstrong Economics
 
I hope your night is going better...

Asian stocks are falling...

011916b.gif


Oil futures dumping again...

011916c.gif


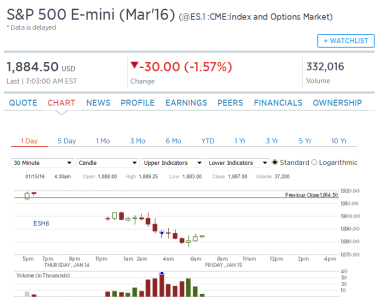
And the S&P and Nasdaq futures are testing Tuesday's lows.
 
Real-Time Stock Indices Futures


Real Time Streaming Futures Quotes (CFDs)

PricePerformanceTechnicalSpecification


11:30 pm CT 1/19/16 Forecast: Pain, followed by widely scattered despair.

[TABLE="class: genTbl closedTbl crossRatesTbl, width: 1"]
[TR]
[TH="class: flag, align: center"][/TH]
[TH="class: left noWrap elp pointer"]Index[/TH]
[TH="class: left pointer"]Month[/TH]
[TH="align: right"]Last[/TH]
[TH="align: right"]Prev.[/TH]
[TH="align: right"]High[/TH]
[TH="align: right"]Low[/TH]
[TH="class: pointer, align: right"]Chg.[/TH]
[TH="class: pointer, align: right"]Chg. %[/TH]
[TH="class: pointer, align: right"]Time[/TH]
[TH="class: icon pointer, align: center"][/TH]
[/TR]
[TR]
[TD="class: flag, align: center"][/TD]
[TD="class: bold left noWrap elp"]Dow 30[/TD]
[TD="class: left noWrap"]Mar 16[/TD]
[TD="class: pid-8873-last greenBg, bgcolor: #C2F2C2, align: right"]15,633.0[/TD]
[TD="class: pid-8873-last_close, align: right"]15,913.0[/TD]
[TD="class: pid-8873-high, align: right"]15,939.5[/TD]
[TD="class: pid-8873-low, align: right"]15,627.5[/TD]
[TD="class: bold pid-8873-pc redFont, align: right"]-280.0[/TD]
[TD="class: bold pid-8873-pcp redFont, align: right"]-1.76%[/TD]
[TD="class: pid-8873-time, align: right"]05:35:14[/TD]
[TD="class: icon, align: center"][/TD]
[/TR]
[TR]
[TD="class: flag, align: center"][/TD]
[TD="class: bold left noWrap elp"]S&P 500[/TD]
[TD="class: left noWrap"]Mar 16[/TD]
[TD="class: pid-8839-last, align: right"]1,841.00[/TD]
[TD="class: pid-8839-last_close, align: right"]1,873.00[/TD]
[TD="class: pid-8839-high, align: right"]1,878.50[/TD]
[TD="class: pid-8839-low, align: right"]1,840.25[/TD]
[TD="class: bold pid-8839-pc redFont, align: right"]-32.00[/TD]
[TD="class: bold pid-8839-pcp redFont, align: right"]-1.71%[/TD]
[TD="class: pid-8839-time, align: right"]05:35:14[/TD]
[TD="class: icon, align: center"][/TD]
[/TR]
[TR="bgcolor: #EDF4FA"]
[TD="class: flag, align: center"][/TD]
[TD="class: bold left noWrap elp"]Nasdaq[/TD]
[TD="class: left noWrap"]Mar 16[/TD]
[TD="class: pid-8874-last redBg, bgcolor: #FCDEDE, align: right"]4,064.50[/TD]
[TD="class: pid-8874-last_close, align: right"]4,144.50[/TD]
[TD="class: pid-8874-high, align: right"]4,156.25[/TD]
[TD="class: pid-8874-low, align: right"]4,059.88[/TD]
[TD="class: bold pid-8874-pc redFont, align: right"]-80.00[/TD]
[TD="class: bold pid-8874-pcp redFont, align: right"]-1.93%[/TD]
[TD="class: pid-8874-time, align: right"]05:35:14[/TD]
[TD="class: icon, align: center"][/TD]
[/TR]
[TR]
[TD="class: flag, align: center"][/TD]
[TD="class: bold left noWrap elp"]SmallCap 2000[/TD]
[TD="class: left noWrap"]Mar 16[/TD]
[TD="class: pid-8864-last greenBg, bgcolor: #C2F2C2, align: right"]974.6[/TD]
[TD="class: pid-8864-last_close, align: right"]989.9[/TD]
[TD="class: pid-8864-high, align: right"]990.0[/TD]
[TD="class: pid-8864-low, align: right"]974.1[/TD]
[TD="class: bold pid-8864-pc redFont, align: right"]-15.3[/TD]
[TD="class: bold pid-8864-pcp redFont, align: right"]-1.55%[/TD]
[TD="class: pid-8864-time, align: right"]05:35:14[/TD]
[TD="class: icon, align: center"][/TD]
[/TR]
[TR]
[TD="class: flag, align: center"][/TD]
[TD="class: bold left noWrap elp"]S&P 500 VIX[/TD]
[TD="class: left noWrap"]Feb 16[/TD]
[TD="class: pid-8884-last, align: right"]25.68[/TD]
[TD="class: pid-8884-last_close, align: right"]24.13[/TD]
[TD="class: pid-8884-high, align: right"]25.68[/TD]
[TD="class: pid-8884-low, align: right"]23.98[/TD]
[TD="class: bold pid-8884-pc greenFont, align: right"]+1.55[/TD]
[TD="class: bold pid-8884-pcp greenFont, align: right"]+6.42%[/TD]
[TD="class: pid-8884-time, align: right"]05:35:00[/TD]
[TD="class: icon, align: center"][/TD]
[/TR]
[TR]
[TD="class: flag, align: center"][/TD]
[TD="class: bold left noWrap elp"]S&P/TSX 60[/TD]
[TD="class: left noWrap"]Mar 16[/TD]
[TD="class: pid-8981-last, align: right"]703.25[/TD]
[TD="class: pid-8981-last_close, align: right"]703.25[/TD]
[TD="class: pid-8981-high, align: right"]709.60[/TD]
[TD="class: pid-8981-low, align: right"]696.25[/TD]
[TD="class: bold greenFont pid-8981-pc, align: right"]+3.45[/TD]
[TD="class: bold greenFont pid-8981-pcp, align: right"]+0.49%[/TD]
[TD="class: pid-8981-time, align: right"]19/01[/TD]
[TD="class: icon, align: center"][/TD]
[/TR]
[TR]
[TD="class: flag, align: center"][/TD]
[TD="class: bold left noWrap elp"]DAX[/TD]
[TD="class: left noWrap"]Mar 16[/TD]
[TD="class: pid-8826-last, align: right"]9,420.6[/TD]
[TD="class: pid-8826-last_close, align: right"]9,602.6[/TD]
[TD="class: pid-8826-high, align: right"]9,635.8[/TD]
[TD="class: pid-8826-low, align: right"]9,405.8[/TD]
[TD="class: bold pid-8826-pc redFont, align: right"]-182.0[/TD]
[TD="class: bold pid-8826-pcp redFont, align: right"]-1.90%[/TD]
[TD="class: pid-8826-time, align: right"]05:35:09[/TD]
[TD="class: icon, align: center"][/TD]
[/TR]
[TR]
[TD="class: flag, align: center"][/TD]
[TD="class: bold left noWrap elp"]CAC 40[/TD]
[TD="class: left noWrap"]Feb 16[/TD]
[TD="class: pid-8853-last, align: right"]4,148.9[/TD]
[TD="class: pid-8853-last_close, align: right"]4,237.5[/TD]
[TD="class: pid-8853-high, align: right"]4,256.1[/TD]
[TD="class: pid-8853-low, align: right"]4,148.5[/TD]
[TD="class: bold pid-8853-pc redFont, align: right"]-88.6[/TD]
[TD="class: bold pid-8853-pcp redFont, align: right"]-2.09%[/TD]
[TD="class: pid-8853-time, align: right"]05:35:09[/TD]
[TD="class: icon, align: center"][/TD]
[/TR]
[TR]
[TD="class: flag, align: center"][/TD]
[TD="class: bold left noWrap elp"]FTSE 100[/TD]
[TD="class: left noWrap"]Mar 16[/TD]
[TD="class: pid-8838-last, align: right"]5,700.5[/TD]
[TD="class: pid-8838-last_close, align: right"]5,787.3[/TD]
[TD="class: pid-8838-high, align: right"]5,806.5[/TD]
[TD="class: pid-8838-low, align: right"]5,699.3[/TD]
[TD="class: bold pid-8838-pc redFont, align: right"]-86.8[/TD]
[TD="class: bold pid-8838-pcp redFont, align: right"]-1.50%[/TD]
[TD="class: pid-8838-time, align: right"]05:35:09[/TD]
[TD="class: icon, align: center"][/TD]
[/TR]
[TR]
[TD="class: flag, align: center"][/TD]
[TD="class: bold left noWrap elp"]Euro Stoxx 50[/TD]
[TD="class: left noWrap"]Mar 16[/TD]
[TD="class: pid-8867-last, align: right"]2,961.5[/TD]
[TD="class: pid-8867-last_close, align: right"]2,961.5[/TD]
[TD="class: pid-8867-high, align: right"]3,003.5[/TD]
[TD="class: pid-8867-low, align: right"]2,929.5[/TD]
[TD="class: bold greenFont pid-8867-pc, align: right"]+32.5[/TD]
[TD="class: bold greenFont pid-8867-pcp, align: right"]+1.11%[/TD]
[TD="class: pid-8867-time, align: right"]19/[/TD]
[TD="class: icon, align: center"][/TD]
[/TR]
[/TABLE]
 
As of right now, the Transports are down 23% since the November peak at the 200-day EMA. They are down 30% from the highs in late 2014.

The Russell 2000 is down 20% from the 1st of December, and 26% from the June highs last year.

Oil is down 55% since the summer, and an incredible 74% from the summer of 2014.

It seems unreal, but this kind of pain means relief should be close at hand, although it never feels like it.

Barring a crash, markets don't go straight down so again, relief is likely on the way, and bear market rallies can be very powerful. But if you are not a buy and holder you may have to be ready to sell those rallies. As hard as it is to buy under these conditions, it's similarly difficult to sell snap-back rallies out of fear of missing gains.

In an emotional market like this, it's all about fear and greed.
 
Great post!

As of right now, the Transports are down 23% since the November peak at the 200-day EMA. They are down 30% from the highs in late 2014.

The Russell 2000 is down 20% from the 1st of December, and 26% from the June highs last year.

Oil is down 55% since the summer, and an incredible 74% from the summer of 2014.

It seems unreal, but this kind of pain means relief should be close at hand, although it never feels like it.

Barring a crash, markets don't go straight down so again, relief is likely on the way, and bear market rallies can be very powerful. But if you are not a buy and holder you may have to be ready to sell those rallies. As hard as it is to buy under these conditions, it's similarly difficult to sell snap-back rallies out of fear of missing gains.

In an emotional market like this, it's all about fear and greed.
 
Back
Top