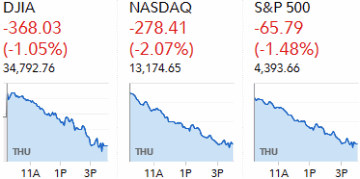
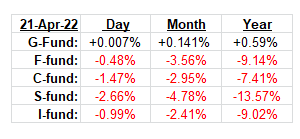
Thursday saw some predictable action, and some chaos all within a 6 hour period. Stocks gapped higher and broke through some key resistance, and then Fed Chair Jerome Powell started talking and everything flipped over and landed right on their heads. The selling was broad as stocks, commodities, bonds, almost everything, was taken to the woodshed, although oil, the one thing consumers want to see come down, rallied on the day. A 53 point gain in the opening minutes for the S&P 500 turned into a 66-point loss y the close.
[TABLE="align: center"]
[TR]
[TD="align: center"]
 [/TD]
[/TD]
[TD]
[/TD]
[TD="width: 338, align: center"] Daily TSP Funds Return
 [TABLE="align: center"]
[TR]
[TD="align: right"][/TD]
[/TR]
[/TABLE]
[/TD]
[/TR]
[/TABLE]
The Fed comments did push the dollar higher, so maybe that was part of it, but it seems to be rallying on the same news again and again. The 10-year Yield was up testing the highs from earlier in the week.
Bottom line: The charts look bad, so the action is cringe-worthy. But investor sentiment had gotten so bearish that the downside could have a cushion. It's been so choppy that it wouldn't be a huge surprise to see a bounce back today - but oh those charts. Yuck!
We looked at the S&P 500 (C-fund) above.
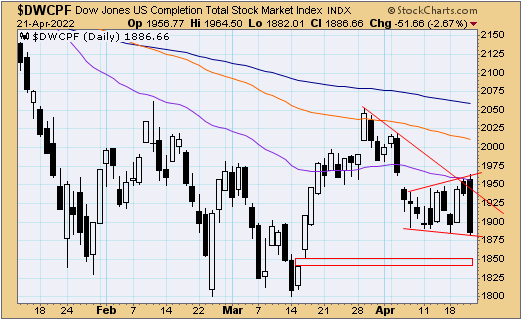
DWCPF (S-fund / small caps) made a new short-term low and that is a clear megaphone pattern, which trade similar to bear flags, which means this doesn't look good. It could break down today, or run back to the top resistance line, but overall this is considered a bearish pattern for small caps. The open gap near 1840 is again within reach.
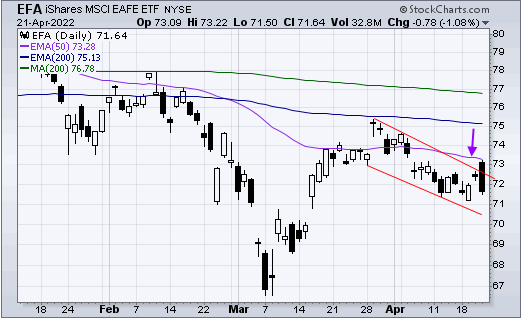
The EFA (I-fund) slammed into that 50-day EMA as if it was a brick wall and tumbled over. There was hope for a breakout, but hope was quickly lost. The question is, have investors gotten so down on the situation, that things can only look up? Wishful thinking?
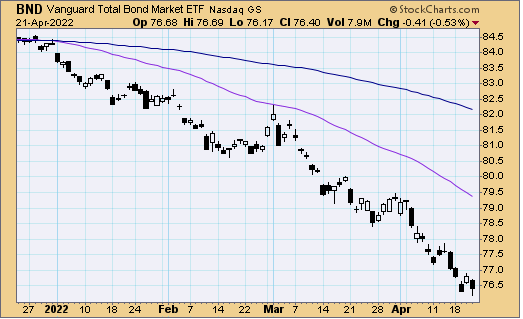
BND (Bonds / F-fund) -- ugly. Nuff said.
Read more in today's TSP Talk Plus Report. We post more charts, indicators and analysis, plus discuss the allocations of the TSP and ETF Systems. For more information on how to gain access and a list of the benefits of being a subscriber, please go to: www.tsptalk.com/plus.php
For more info our other premium services, please go here... www.tsptalk.com/premiums.html
To get weekly or daily notifications when we post new commentary, sign up HERE.
Thanks for reading. Have a great weekend!
Tom Crowley
Posted daily at www.tsptalk.com/comments.php
The legal stuff: This information is for educational purposes only! This is not advice or a recommendation. We do not give investment advice. Do not act on this data. Do not buy, sell or trade the funds mentioned herein based on this information. We may trade these funds differently than discussed above. We use additional methods and strategies to determine fund positions.
[TABLE="align: center"]
[TR]
[TD="align: center"]

[TD]
[/TD]
[TD="width: 338, align: center"] Daily TSP Funds Return

[TR]
[TD="align: right"][/TD]
[/TR]
[/TABLE]
[/TD]
[/TR]
[/TABLE]
The technical picture was on the verge of a huge improvement, but that's when the Fed stepped in and said things that it feels like we all already knew, but it triggered another bout of selling and now we have some very troubling looking charts. It's amazing that one man's comments can do something like that, assuming there wasn't something else going on that was not being told?
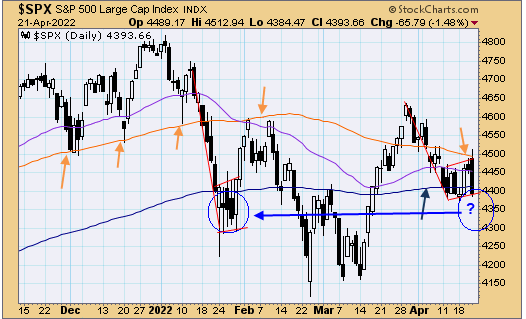
Let's go right to the chart of the S&P 500, which gapped up and quickly moved above that stubborn orange moving average that has held as support, as well as squashed rallies for the last several months. Within a few hours the breakout above that average turned into a break below the 200-day EMA, which was a long way down. The worst thing on this chart right now is that bear flag, and at yesterday's open it looked like that was going to be broken on the upside, but what a difference one person, and 6 hours can make.
The question I have is whether that was some kind of a shakeout from large money managers because we had seen how bearish the public had gotten on stocks with the AAII Investor Sentiment Survey coming in near 16% bulls last week which was a 30 year low. That was followed up with a 19% bullish reading in this week's survey, so there was a lot of bearish people out there already and generally when the "herd" gets very bearish, they've usually already exhausted their selling and tend to have a lot of cash on hand.
This is why I am concerned that there is something else brewing out there that has not been made completely public. That may have been a curveball to get us to lean the wrong way so that pros can pick up some bargains perhaps next week when earnings season hits its crescendo when Apple, Amazon, Alphabet, Microsoft, and Meta (aka Facebook) all report earnings.
And, as mentioned about every 10 minutes, we get the Fed's FOMC meeting and rate hike the following week. We all know what they are planning to do. Right now the market has priced in a 98% chance of a 0.50% hike. It was 94% the day before so there's nothing new that we can see.
If the charts didn't look so bad I would be very bullish about this pullback buying opportunity, but the charts can't be completely ignored.
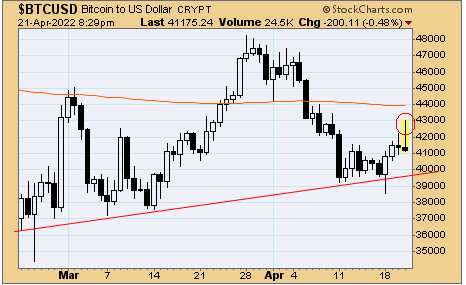
I mentioned the market following bitcoin and even it flipped over yesterday giving up a $1000+ point gain to close down on the day. That is an ugly reversal and I would be surprised if what the Fed had to say was the reason.
Let's go right to the chart of the S&P 500, which gapped up and quickly moved above that stubborn orange moving average that has held as support, as well as squashed rallies for the last several months. Within a few hours the breakout above that average turned into a break below the 200-day EMA, which was a long way down. The worst thing on this chart right now is that bear flag, and at yesterday's open it looked like that was going to be broken on the upside, but what a difference one person, and 6 hours can make.

The question I have is whether that was some kind of a shakeout from large money managers because we had seen how bearish the public had gotten on stocks with the AAII Investor Sentiment Survey coming in near 16% bulls last week which was a 30 year low. That was followed up with a 19% bullish reading in this week's survey, so there was a lot of bearish people out there already and generally when the "herd" gets very bearish, they've usually already exhausted their selling and tend to have a lot of cash on hand.
This is why I am concerned that there is something else brewing out there that has not been made completely public. That may have been a curveball to get us to lean the wrong way so that pros can pick up some bargains perhaps next week when earnings season hits its crescendo when Apple, Amazon, Alphabet, Microsoft, and Meta (aka Facebook) all report earnings.
And, as mentioned about every 10 minutes, we get the Fed's FOMC meeting and rate hike the following week. We all know what they are planning to do. Right now the market has priced in a 98% chance of a 0.50% hike. It was 94% the day before so there's nothing new that we can see.
If the charts didn't look so bad I would be very bullish about this pullback buying opportunity, but the charts can't be completely ignored.
I mentioned the market following bitcoin and even it flipped over yesterday giving up a $1000+ point gain to close down on the day. That is an ugly reversal and I would be surprised if what the Fed had to say was the reason.

The Fed comments did push the dollar higher, so maybe that was part of it, but it seems to be rallying on the same news again and again. The 10-year Yield was up testing the highs from earlier in the week.
Bottom line: The charts look bad, so the action is cringe-worthy. But investor sentiment had gotten so bearish that the downside could have a cushion. It's been so choppy that it wouldn't be a huge surprise to see a bounce back today - but oh those charts. Yuck!
We looked at the S&P 500 (C-fund) above.
DWCPF (S-fund / small caps) made a new short-term low and that is a clear megaphone pattern, which trade similar to bear flags, which means this doesn't look good. It could break down today, or run back to the top resistance line, but overall this is considered a bearish pattern for small caps. The open gap near 1840 is again within reach.

The EFA (I-fund) slammed into that 50-day EMA as if it was a brick wall and tumbled over. There was hope for a breakout, but hope was quickly lost. The question is, have investors gotten so down on the situation, that things can only look up? Wishful thinking?

BND (Bonds / F-fund) -- ugly. Nuff said.

Read more in today's TSP Talk Plus Report. We post more charts, indicators and analysis, plus discuss the allocations of the TSP and ETF Systems. For more information on how to gain access and a list of the benefits of being a subscriber, please go to: www.tsptalk.com/plus.php
For more info our other premium services, please go here... www.tsptalk.com/premiums.html
To get weekly or daily notifications when we post new commentary, sign up HERE.
Thanks for reading. Have a great weekend!
Tom Crowley
Posted daily at www.tsptalk.com/comments.php
The legal stuff: This information is for educational purposes only! This is not advice or a recommendation. We do not give investment advice. Do not act on this data. Do not buy, sell or trade the funds mentioned herein based on this information. We may trade these funds differently than discussed above. We use additional methods and strategies to determine fund positions.
