Greetings
TLDR: When The C-Fund closes up, the FSI Funds are more likely to close up. When The C-Fund closes down, the FSI Funds are less likely to close down.
Since I consider our C-Fund to be the standard by which all other funds should be measured, I thought it would be a good time to measure the correlation of the funds. Simply put, how often do the FSI funds trade in the same direction or against the C-Fund. For this study I've chosen to use 11, 27, 55, & 101 sessions, this will give us a good sample of data where the markets were trading both Bullish & Bearish.
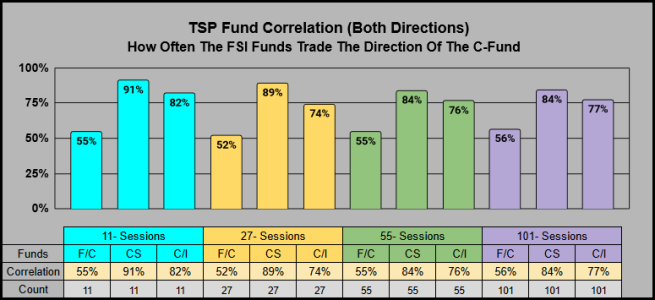
First up, is a chart that shows both directions for the C-Fund, and how often the FSI funds traded in the same direction. As you might suspect, the S-Fund has the strongest correlation across all time frames, followed by the I-Fund (and in a distant third) the F-Fund.

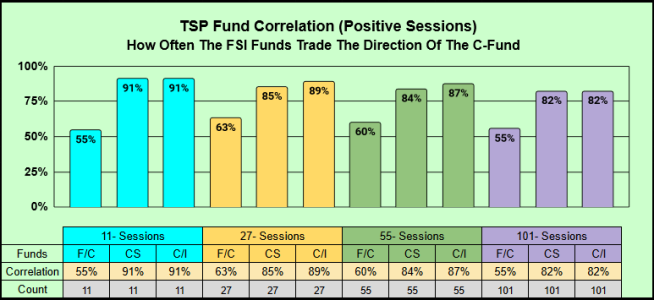
The second charts shows only the positive days where the C-Fund closed up. What's interesting, is that the positive correlation with the C & I Funds gets stronger on all time frames. The I-Fund ties with the S-Fund on 11 & 101 sessions & beats the S-Fund on 27 & 55 sessions. Perhaps the I-Fund performance gap improves based on the direction of the dollar, (this data has not been factored in for this study).

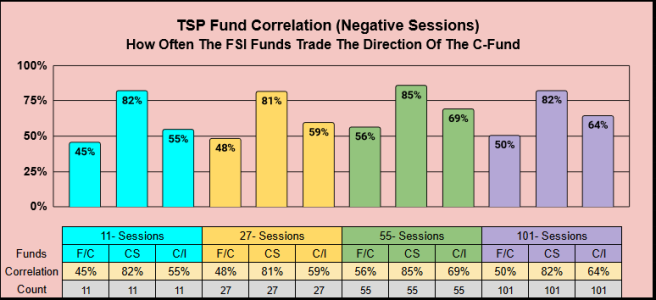
The Third chart shows only the negative days where the C-Fund closed down. This is where it gets fun, with only 1 exception, the FSI funds are all less likely to close down with the C-Fund. The S-Fund correlation is still the strongest, but the F & I funds gain an advance here (breaking away from the C-Fund).

Thanks for reading... Jason
TLDR: When The C-Fund closes up, the FSI Funds are more likely to close up. When The C-Fund closes down, the FSI Funds are less likely to close down.
Since I consider our C-Fund to be the standard by which all other funds should be measured, I thought it would be a good time to measure the correlation of the funds. Simply put, how often do the FSI funds trade in the same direction or against the C-Fund. For this study I've chosen to use 11, 27, 55, & 101 sessions, this will give us a good sample of data where the markets were trading both Bullish & Bearish.
First up, is a chart that shows both directions for the C-Fund, and how often the FSI funds traded in the same direction. As you might suspect, the S-Fund has the strongest correlation across all time frames, followed by the I-Fund (and in a distant third) the F-Fund.

The second charts shows only the positive days where the C-Fund closed up. What's interesting, is that the positive correlation with the C & I Funds gets stronger on all time frames. The I-Fund ties with the S-Fund on 11 & 101 sessions & beats the S-Fund on 27 & 55 sessions. Perhaps the I-Fund performance gap improves based on the direction of the dollar, (this data has not been factored in for this study).

The Third chart shows only the negative days where the C-Fund closed down. This is where it gets fun, with only 1 exception, the FSI funds are all less likely to close down with the C-Fund. The S-Fund correlation is still the strongest, but the F & I funds gain an advance here (breaking away from the C-Fund).

Thanks for reading... Jason
