As many of you know, I keep track of our week to week TSP allocations across the Tracker, looking for statistically significant clues that suggest market direction for a given week. I keep statistics on the Top 50 of our tracker and the entire tracker itself. I've primarily looked for signals related to weekly shifts in stock exposure and I've found that whenever there are shifts of more than 10% in the Top 50, either up or down, it tends to be predictive of market action for that week.
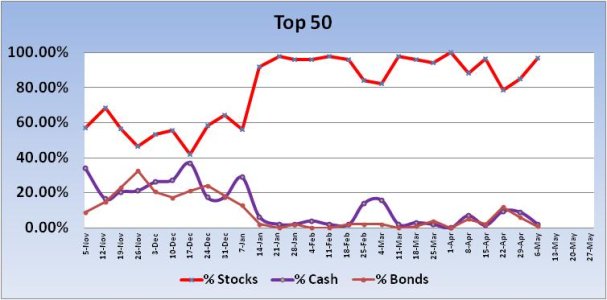
But this week, I've noted something else of probable value. Let me begin by saying I have a sell signal from the Top 50 this week as they increased their stock exposure by more than 10% (11.88% to be exact). But this is a bull market and that signal, while relatively accurate over the longer term, has not been as profitable as bearish shifts of more than 10%. But let's set that sell signal aside for the moment.
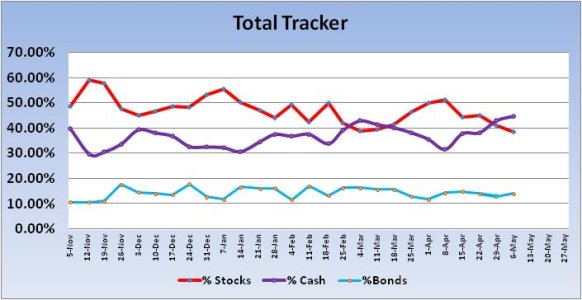
As I was looking over my spreadsheets, I noticed that the Total Tracker had decreased their stock exposure even more than it already was, and that was already quite conservative. The Total Tracker saw total stock exposure dip by 2.82% to a total stock allocation of just 38.37%. Now that may not seem like a big dip, and by itself it's not. But that 38.37% exposure was sure low in such a profitable bull market.
After doing some research with my data, I discovered something of value. So let's take a look at the charts:

As I've already mentioned, the Top 50 increased their stock exposure by 11.88%. That's a sell signal as a general rule, but read on.

Here we can see the dip in stock allocations for the Total Tracker. Look at where that red line is (stock exposure). It's below 40%. Now look at the next chart.

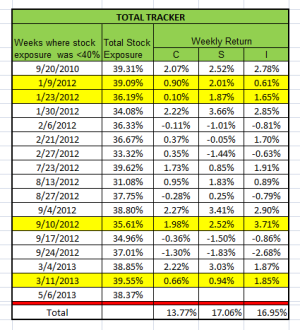
I looked back at my numbers and identified every week where the Total Tracker had a stock allocation under 40%. There was a total of 16 weeks going back to mid 2010. This data shows that the market had a tendency to be higher whenever the Total Tracker showed stock exposure under 40%. And out of the 16 weeks, look at the collective totals. They are significant.
So we have conflict, right? The Top 50 is showing a sell signal, but this data suggests price is heading higher this week. Which signal do I trust?
That's when I dug a little further.
I went back into the data to find any instances where the Top 50 had a sell signal the same week the Total Tracker had a stock exposure under 40%. There were four instances, and each of them is highlighted in yellow. In all four cases, the stock market was higher that week. So this data is suggesting higher prices by the end of the week.

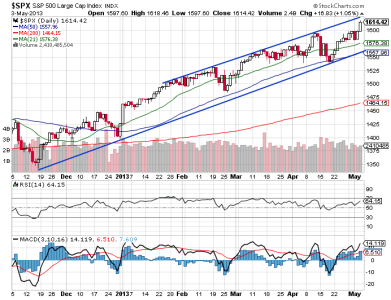
Now let's look at the S&P 500. First, this is a bullish chart. RSI and MACD are rising and price has remained in an upwardly biased, relatively tight intermediate term channel. And the 21 dma has been above the 50 dma, which has been above the 200 dma since the beginning of the year. That's the bigger picture. In the short term, Friday's close saw price pull up not far under that upper trend line. This would be a logical area to expect some weakness.
So for this week, I'm expecting higher prices by the end of the week, but I'll also be looking for some weakness to develop probably early on in the week. But be aware that we could tag that upper trend line first. And that any weakness we do get may not amount to a whole lot (this is a strong bull). I'm thinking the 21 dma is a reasonable target, but with a buy signal looking like a reasonable play, I'd be surprised if we even got that low. I also realize that this is May, which is historically weak, but the underlying support for this market has not gone away as yet. And I'm not inclined to argue with that.
But this week, I've noted something else of probable value. Let me begin by saying I have a sell signal from the Top 50 this week as they increased their stock exposure by more than 10% (11.88% to be exact). But this is a bull market and that signal, while relatively accurate over the longer term, has not been as profitable as bearish shifts of more than 10%. But let's set that sell signal aside for the moment.
As I was looking over my spreadsheets, I noticed that the Total Tracker had decreased their stock exposure even more than it already was, and that was already quite conservative. The Total Tracker saw total stock exposure dip by 2.82% to a total stock allocation of just 38.37%. Now that may not seem like a big dip, and by itself it's not. But that 38.37% exposure was sure low in such a profitable bull market.
After doing some research with my data, I discovered something of value. So let's take a look at the charts:

As I've already mentioned, the Top 50 increased their stock exposure by 11.88%. That's a sell signal as a general rule, but read on.

Here we can see the dip in stock allocations for the Total Tracker. Look at where that red line is (stock exposure). It's below 40%. Now look at the next chart.

I looked back at my numbers and identified every week where the Total Tracker had a stock allocation under 40%. There was a total of 16 weeks going back to mid 2010. This data shows that the market had a tendency to be higher whenever the Total Tracker showed stock exposure under 40%. And out of the 16 weeks, look at the collective totals. They are significant.
So we have conflict, right? The Top 50 is showing a sell signal, but this data suggests price is heading higher this week. Which signal do I trust?
That's when I dug a little further.
I went back into the data to find any instances where the Top 50 had a sell signal the same week the Total Tracker had a stock exposure under 40%. There were four instances, and each of them is highlighted in yellow. In all four cases, the stock market was higher that week. So this data is suggesting higher prices by the end of the week.

Now let's look at the S&P 500. First, this is a bullish chart. RSI and MACD are rising and price has remained in an upwardly biased, relatively tight intermediate term channel. And the 21 dma has been above the 50 dma, which has been above the 200 dma since the beginning of the year. That's the bigger picture. In the short term, Friday's close saw price pull up not far under that upper trend line. This would be a logical area to expect some weakness.
So for this week, I'm expecting higher prices by the end of the week, but I'll also be looking for some weakness to develop probably early on in the week. But be aware that we could tag that upper trend line first. And that any weakness we do get may not amount to a whole lot (this is a strong bull). I'm thinking the 21 dma is a reasonable target, but with a buy signal looking like a reasonable play, I'd be surprised if we even got that low. I also realize that this is May, which is historically weak, but the underlying support for this market has not gone away as yet. And I'm not inclined to argue with that.
