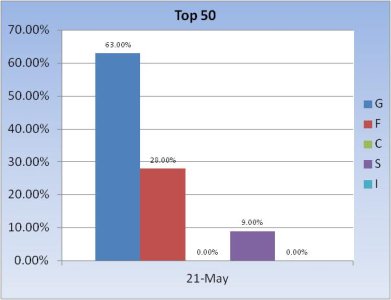
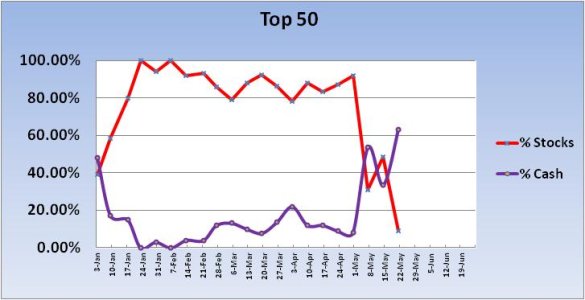
It wasn't that long ago (April 30th to be exact), that the Top 50 had a total stock exposure of 92%. The week after that their exposure dropped a whopping 61% for a total stock allocation of 31%. The broader market fell that week, but not by much (S fund was only down about 0.24%). We had some dip buyers in the group a week later as total stock exposure for the Top 50 rose to 48.6%. But those dip buyers met with stiff selling pressure as stocks plummeted (S fund was down 6.03%) for the week.
This week, the Top 50 has all but abandoned stocks as their collective allocation is just 9%.


So that 61% drop in stock exposure the first week of June turned out to be prescient for the Top 50. And with only token stock exposure going into the new week can we expect further downside price pressure over the coming days?


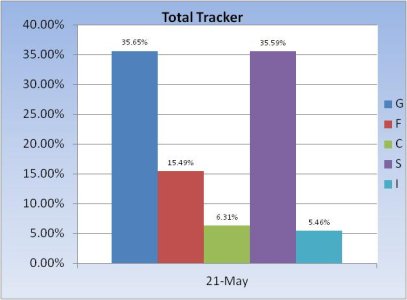
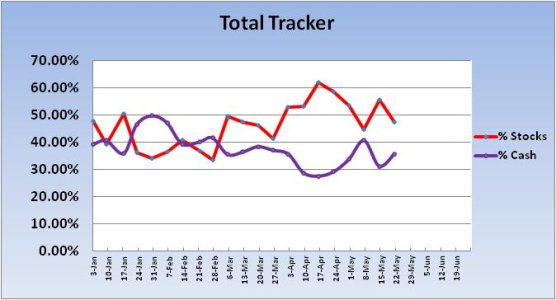
Just like the Top 50, the Total Tracker showed some dip buying last week too. And this week, just like the Top 50, total stock exposure fell going into the new week (by 8.11%).
Surprisingly, the Seven Sentinels remain in a buy condition, but I have mixed feelings about that. When the last buy was triggered, I cautioned that more risk averse folks should stay in cash. That turned out to be good advice. I was rightly concerned about whipsaws at the time. I'm now a bit concerned that a sell could be triggered at a very oversold point in the market sometime this week. Unless, of course, the market turns very soon.
This week, the Top 50 has all but abandoned stocks as their collective allocation is just 9%.


So that 61% drop in stock exposure the first week of June turned out to be prescient for the Top 50. And with only token stock exposure going into the new week can we expect further downside price pressure over the coming days?


Just like the Top 50, the Total Tracker showed some dip buying last week too. And this week, just like the Top 50, total stock exposure fell going into the new week (by 8.11%).
Surprisingly, the Seven Sentinels remain in a buy condition, but I have mixed feelings about that. When the last buy was triggered, I cautioned that more risk averse folks should stay in cash. That turned out to be good advice. I was rightly concerned about whipsaws at the time. I'm now a bit concerned that a sell could be triggered at a very oversold point in the market sometime this week. Unless, of course, the market turns very soon.
