Last week, our sentiment survey was a bit bearish with a 58% bull reading. And I noted that the AAII survey was very bullish with 49.2% bulls and just 17.6% bears. Sentiment is usually used as a contrarian indicator, but the AAII survey had not been a fade for some time. That may change down the road, but I took the view that this was supportive for the market unless proven otherwise. And with liquidity very elevated, I had to look higher. The caveat was that liquidity had to remain elevated. It started out that way early in the week, but as the week wore on, levels were dropping off. And so did the indexes, although the C fund managed a very modest gain.
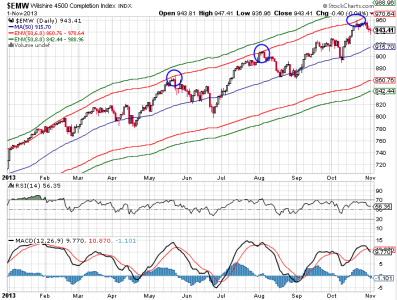
I did point out that the Wilshire 4500 (S fund) showed price tagging the 6% envelope the previous week and that this was an area that had seen pullbacks start shortly after. That's how the market is playing out currently as weakness is showing up in that fund. So risk appears to be rising in the short term, meaning this market may be poised for more weakness over the coming days.
Sentiment remains on the bullish side, but not to the extent it was the previous week as our sentiment survey came in at 53% bulls and 35% bears. But what I am more focused on is that the auto-tracker shows us buying weakness last week as total stock allocations were up 4.1%. Dip buying has worked for some time, but dip buying in an sentiment environment that is on the bullish side may bring on more selling pressure. And as I said, liquidity is falling off and the Wilshire chart is bearish. That has me looking for more weakness.
Here's some charts:

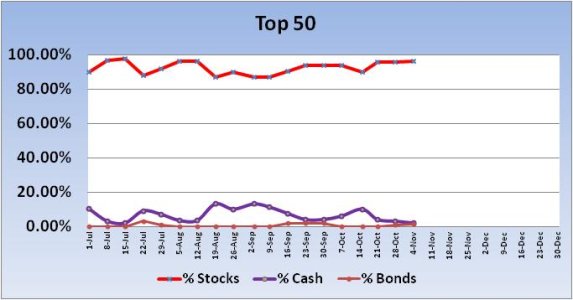
No signal from the Top 50 this week. For the new trading week, total stock allocations increased by -0.5% to a total allocation of 96.38%. This is a bullish reading for this group longer term (more than a week).

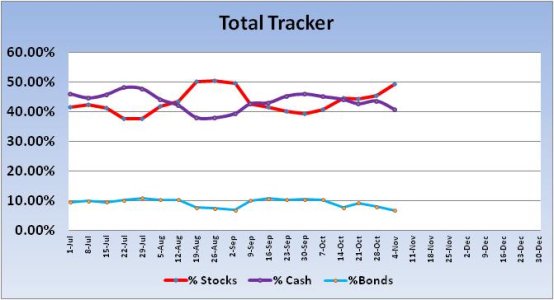
No signal was generated from the Total Tracker this week. But stock allocations rose by 4.1% to a total stock allocation of 49.41%. So our sentiment reading got a bit more bearish, but stock allocations rose a fair amount. I looked at the data for sentiment readings similar to this week’s reading, but found the data to be mixed. In particular I was looking for similar sentiment with a rise in stock allocations, but there was not enough data to support a conclusion. I will say that there were several weeks of significant stock market losses in this sentiment data range and that makes me inclined to lean on the bearish side here (for next week).

At this point, the Wilshire 4500 looks to be starting its down cycle after tagging the 6% envelope more than a week ago. With momentum turning down, this chart is now looking bearish. The 50 day moving average has been a good target area for support. But I will caution that this target area is widely recognized around the market. I’m willing to anticipate support at that moving average, but I’ll have to see how bearish sentiment gets if price approaches that level before I’d trust a potential reversal in that area.
So I am anticipating lower prices next week, but I am not bearish longer term. I am continuing to look for an opportunity to buy weakness and I may get that chance next week. But I'll take it one day at a time and see how things unfold. There is no reason to get too anxious to ramp up exposure quickly with the market not that far off its highs and looking a bit vulnerable right now.
To see this week's full analysis, follow this link http://www.tsptalk.com/members/
I did point out that the Wilshire 4500 (S fund) showed price tagging the 6% envelope the previous week and that this was an area that had seen pullbacks start shortly after. That's how the market is playing out currently as weakness is showing up in that fund. So risk appears to be rising in the short term, meaning this market may be poised for more weakness over the coming days.
Sentiment remains on the bullish side, but not to the extent it was the previous week as our sentiment survey came in at 53% bulls and 35% bears. But what I am more focused on is that the auto-tracker shows us buying weakness last week as total stock allocations were up 4.1%. Dip buying has worked for some time, but dip buying in an sentiment environment that is on the bullish side may bring on more selling pressure. And as I said, liquidity is falling off and the Wilshire chart is bearish. That has me looking for more weakness.
Here's some charts:

No signal from the Top 50 this week. For the new trading week, total stock allocations increased by -0.5% to a total allocation of 96.38%. This is a bullish reading for this group longer term (more than a week).

No signal was generated from the Total Tracker this week. But stock allocations rose by 4.1% to a total stock allocation of 49.41%. So our sentiment reading got a bit more bearish, but stock allocations rose a fair amount. I looked at the data for sentiment readings similar to this week’s reading, but found the data to be mixed. In particular I was looking for similar sentiment with a rise in stock allocations, but there was not enough data to support a conclusion. I will say that there were several weeks of significant stock market losses in this sentiment data range and that makes me inclined to lean on the bearish side here (for next week).

At this point, the Wilshire 4500 looks to be starting its down cycle after tagging the 6% envelope more than a week ago. With momentum turning down, this chart is now looking bearish. The 50 day moving average has been a good target area for support. But I will caution that this target area is widely recognized around the market. I’m willing to anticipate support at that moving average, but I’ll have to see how bearish sentiment gets if price approaches that level before I’d trust a potential reversal in that area.
So I am anticipating lower prices next week, but I am not bearish longer term. I am continuing to look for an opportunity to buy weakness and I may get that chance next week. But I'll take it one day at a time and see how things unfold. There is no reason to get too anxious to ramp up exposure quickly with the market not that far off its highs and looking a bit vulnerable right now.
To see this week's full analysis, follow this link http://www.tsptalk.com/members/
